Estimated Value: $462,820 - $511,000
--
Bed
--
Bath
1,453
Sq Ft
$339/Sq Ft
Est. Value
About This Home
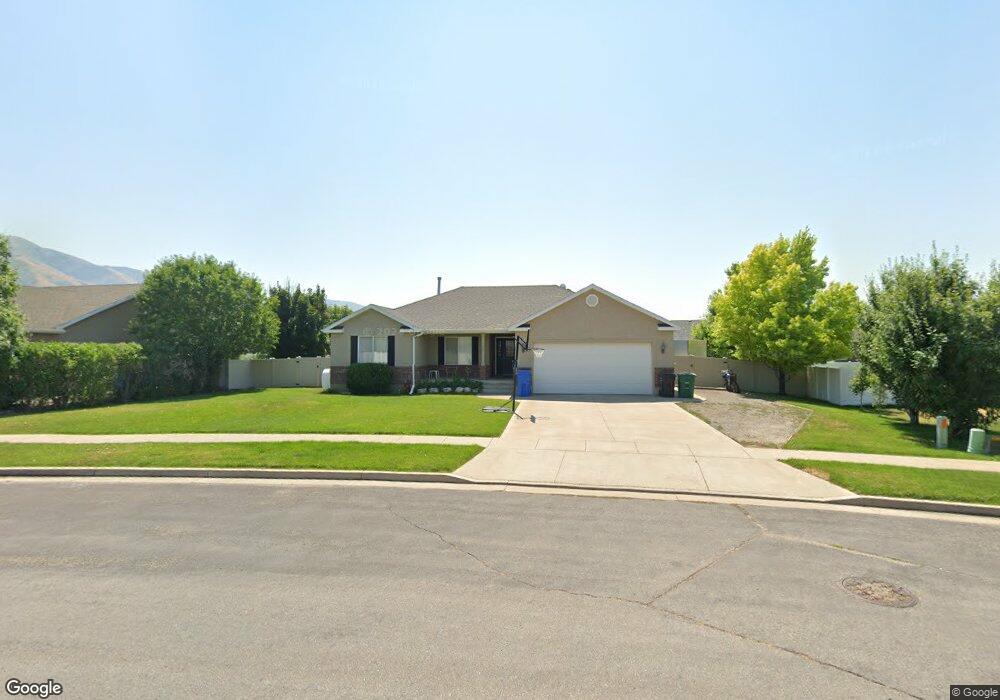
This home is located at 718 E 440 S Unit 14, Hyrum, UT 84319 and is currently estimated at $493,205, approximately $339 per square foot. 718 E 440 S Unit 14 is a home located in Cache County with nearby schools including Millville School, South Cache Middle School, and Mountain Crest High School.
Ownership History
Date
Name
Owned For
Owner Type
Purchase Details
Closed on
Jul 21, 2005
Sold by
Raulinaitis Danielle and Raulinaitis Jeremy L
Bought by
Henderson Eric and Henderson Elaine
Current Estimated Value
Purchase Details
Closed on
Sep 13, 2002
Sold by
Summers Robert and Summers Vaughan
Bought by
Raulinaitis Danielle and Raulinaitis Jeremy L
Home Financials for this Owner
Home Financials are based on the most recent Mortgage that was taken out on this home.
Original Mortgage
$123,900
Interest Rate
6.37%
Purchase Details
Closed on
Apr 1, 2002
Sold by
Continental Park Phase Iii Inc
Bought by
Summers Robert and Summers Vaughan
Home Financials for this Owner
Home Financials are based on the most recent Mortgage that was taken out on this home.
Original Mortgage
$125,010
Interest Rate
6.78%
Mortgage Type
Construction
Create a Home Valuation Report for This Property
The Home Valuation Report is an in-depth analysis detailing your home's value as well as a comparison with similar homes in the area
Home Values in the Area
Average Home Value in this Area
Purchase History
| Date | Buyer | Sale Price | Title Company |
|---|---|---|---|
| Henderson Eric | -- | American Secure Title | |
| Raulinaitis Danielle | -- | American Secure Title | |
| Summers Robert | -- | American Secure Title |
Source: Public Records
Mortgage History
| Date | Status | Borrower | Loan Amount |
|---|---|---|---|
| Previous Owner | Raulinaitis Danielle | $123,900 | |
| Previous Owner | Summers Robert | $125,010 | |
| Closed | Raulinaitis Danielle | $23,200 |
Source: Public Records
Tax History Compared to Growth
Tax History
| Year | Tax Paid | Tax Assessment Tax Assessment Total Assessment is a certain percentage of the fair market value that is determined by local assessors to be the total taxable value of land and additions on the property. | Land | Improvement |
|---|---|---|---|---|
| 2025 | $1,725 | $247,600 | $0 | $0 |
| 2024 | $1,837 | $246,280 | $0 | $0 |
| 2023 | $1,739 | $222,890 | $0 | $0 |
| 2022 | $1,814 | $222,890 | $0 | $0 |
| 2021 | $1,781 | $337,210 | $65,050 | $272,160 |
| 2020 | $1,609 | $285,792 | $65,050 | $220,742 |
| 2019 | $1,573 | $262,742 | $42,000 | $220,742 |
| 2018 | $1,448 | $233,950 | $42,000 | $191,950 |
| 2017 | $1,421 | $119,075 | $0 | $0 |
| 2016 | $1,453 | $119,075 | $0 | $0 |
| 2015 | $1,333 | $108,945 | $0 | $0 |
| 2014 | $1,290 | $107,845 | $0 | $0 |
| 2013 | -- | $107,845 | $0 | $0 |
Source: Public Records
Map
Nearby Homes
- 516 S 770 E
- 532 E 300 S
- 565 E 100 S
- 478 S 1170 E
- 651 E 20 S
- 412 S 1170 E
- 222 S 1170 E
- 177 S 1170 E
- 676 E 1100 S
- Ashland Plan at Canyon Estates
- Magnolia Plan at Canyon Estates
- Richmond Plan at Canyon Estates
- 175 E 500 S
- 667 E 730 N
- 8 S 650 W
- 42 the Hideout at Scare
- 7500 S 1400 W
- 1374 E 340 S
- 1345 E 340 S
- 165 N 800 E