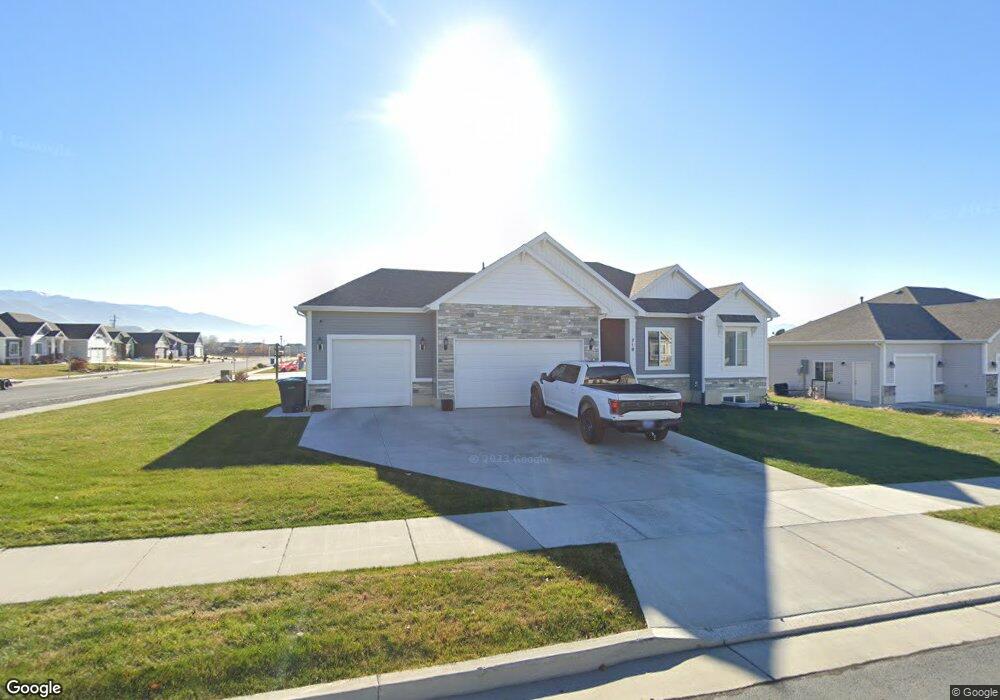
718 E 550 N Smithfield, UT 84335
Estimated Value: $526,000 - $639,000
3
Beds
2
Baths
2,768
Sq Ft
$203/Sq Ft
Est. Value
About This Home
This home is located at 718 E 550 N, Smithfield, UT 84335 and is currently estimated at $561,959, approximately $203 per square foot. 718 E 550 N is a home located in Cache County with nearby schools including Birch Creek School, North Cache Middle School, and White Pine Middle School.
Ownership History
Date
Name
Owned For
Owner Type
Purchase Details
Closed on
Mar 18, 2022
Sold by
Trevor Sorensen
Bought by
Adzitso Koffi
Current Estimated Value
Home Financials for this Owner
Home Financials are based on the most recent Mortgage that was taken out on this home.
Original Mortgage
$534,470
Outstanding Balance
$499,833
Interest Rate
4.16%
Mortgage Type
New Conventional
Estimated Equity
$62,126
Purchase Details
Closed on
May 25, 2017
Sold by
Sorensen Trevor and Sorensen Teisha
Bought by
Sorensen Trevor and Sorensen Teisha
Home Financials for this Owner
Home Financials are based on the most recent Mortgage that was taken out on this home.
Original Mortgage
$254,000
Interest Rate
4.03%
Mortgage Type
New Conventional
Purchase Details
Closed on
Dec 31, 2016
Sold by
Quinton Jessica Tams
Bought by
Sorensen Trevor and Sorensen Teisha
Home Financials for this Owner
Home Financials are based on the most recent Mortgage that was taken out on this home.
Original Mortgage
$247,000
Interest Rate
4.08%
Mortgage Type
Construction
Create a Home Valuation Report for This Property
The Home Valuation Report is an in-depth analysis detailing your home's value as well as a comparison with similar homes in the area
Home Values in the Area
Average Home Value in this Area
Purchase History
| Date | Buyer | Sale Price | Title Company |
|---|---|---|---|
| Adzitso Koffi | -- | Hickman Land Title | |
| Sorensen Trevor | -- | Advanced Title Insurance | |
| Sorensen Trevor | -- | Cache Title Company |
Source: Public Records
Mortgage History
| Date | Status | Borrower | Loan Amount |
|---|---|---|---|
| Open | Adzitso Koffi | $534,470 | |
| Previous Owner | Sorensen Trevor | $254,000 | |
| Previous Owner | Sorensen Trevor | $247,000 |
Source: Public Records
Tax History Compared to Growth
Tax History
| Year | Tax Paid | Tax Assessment Tax Assessment Total Assessment is a certain percentage of the fair market value that is determined by local assessors to be the total taxable value of land and additions on the property. | Land | Improvement |
|---|---|---|---|---|
| 2025 | $233 | $312,490 | $0 | $0 |
| 2024 | $2,442 | $306,715 | $0 | $0 |
| 2023 | $2,554 | $303,325 | $0 | $0 |
| 2022 | $2,596 | $303,325 | $0 | $0 |
| 2021 | $2,042 | $364,436 | $70,000 | $294,436 |
| 2020 | $1,958 | $326,032 | $70,000 | $256,032 |
| 2019 | $2,010 | $319,032 | $63,000 | $256,032 |
| 2018 | $1,899 | $291,600 | $63,000 | $228,600 |
| 2017 | $751 | $63,000 | $0 | $0 |
Source: Public Records
Map
Nearby Homes
- 2075 Canyon Rd
- 536 N 510 E
- 547 N 510 E
- 535 N 510 E
- 525 N 510 E
- 507 N 510 E
- 475 N 510 E
- 623 N 510 E
- 52 N 880 E
- 236 E 300 N
- 168 E 520 N
- 48 Chateau Way Unit 17
- 609 N 130 E
- 1164 E 30 S
- 65 Chateau Way
- 101 E 630 N
- 101 E 630 N Unit 31
- Hallwood Plan at Birch Meadows
- Oakfield Plan at Birch Meadows
- Berrington Plan at Birch Meadows
- 718 E 550 N Unit 17
- 692 E 550 N
- 692 E 550 N Unit 18
- 519 N 730 E
- 519 N 730 E Unit 27
- 717 E 550 N
- 717 E 550 N Unit 13
- 540 N 730 E
- 540 N 730 E Unit 16
- 678 E 550 N Unit 19
- 520 N 730 E Unit 20
- 733 E 550 N Unit 14
- 505 N 730 E Unit 26
- 693 E 550 N Unit 12
- 504 N 680 E Unit 30
- 679 E 550 N Unit 11
- 741 E 550 N Unit 15
- 506 N 730 E Unit 21
- 660 E 550 N
- 660 E 550 N Unit 6