718 Edison Ave Unit 11 Lehigh Acres, FL 33972
Richmond NeighborhoodEstimated Value: $246,000 - $343,000
3
Beds
2
Baths
1,591
Sq Ft
$184/Sq Ft
Est. Value
About This Home
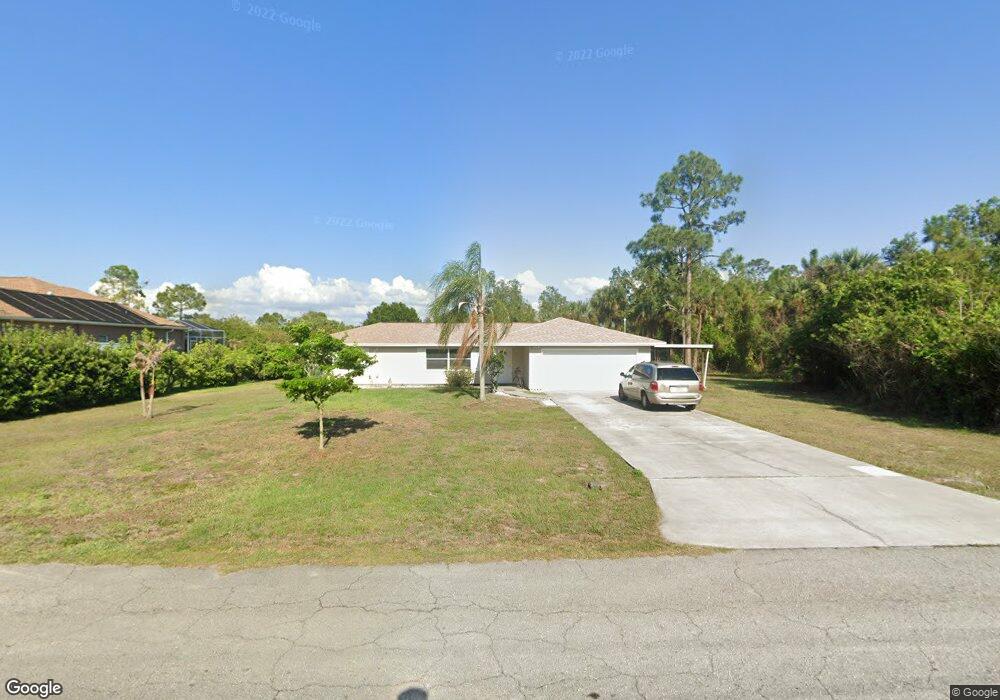
This home is located at 718 Edison Ave Unit 11, Lehigh Acres, FL 33972 and is currently estimated at $292,710, approximately $183 per square foot. 718 Edison Ave Unit 11 is a home located in Lee County with nearby schools including Lehigh Elementary School, The Alva School, and Gateway Elementary School.
Ownership History
Date
Name
Owned For
Owner Type
Purchase Details
Closed on
May 30, 2023
Sold by
Allison Joseph W and Allison Lucy K
Bought by
Smith Michael L and Smith Mildred P
Current Estimated Value
Purchase Details
Closed on
Apr 22, 2014
Sold by
Kosanke Delores
Bought by
Kosanke James and Kosanke Delores
Purchase Details
Closed on
Apr 15, 2014
Sold by
Seaman John C
Bought by
Seaman John C and Seaman Bernice M
Purchase Details
Closed on
Nov 7, 2008
Sold by
Us Bank National Association
Bought by
Allison Joseph W and Allison Lucy K
Purchase Details
Closed on
Aug 2, 2008
Sold by
Smalluck Steven A and Smalluck Christina A
Bought by
Us Bank Na and Structured Asset Investment Loan Trust 2
Purchase Details
Closed on
Jun 30, 1994
Sold by
Federal Home Loan Mortgage Corporation
Bought by
Smalluck Steven A and Smalluck Christina A
Home Financials for this Owner
Home Financials are based on the most recent Mortgage that was taken out on this home.
Original Mortgage
$59,867
Interest Rate
8.51%
Mortgage Type
FHA
Create a Home Valuation Report for This Property
The Home Valuation Report is an in-depth analysis detailing your home's value as well as a comparison with similar homes in the area
Home Values in the Area
Average Home Value in this Area
Purchase History
| Date | Buyer | Sale Price | Title Company |
|---|---|---|---|
| Smith Michael L | $254,700 | Experienced Title | |
| Kosanke James | -- | None Available | |
| Seaman John C | -- | None Available | |
| Allison Joseph W | $70,000 | None Available | |
| Us Bank Na | $247,000 | Attorney | |
| Smalluck Steven A | $59,900 | -- |
Source: Public Records
Mortgage History
| Date | Status | Borrower | Loan Amount |
|---|---|---|---|
| Previous Owner | Smalluck Steven A | $59,867 |
Source: Public Records
Tax History Compared to Growth
Tax History
| Year | Tax Paid | Tax Assessment Tax Assessment Total Assessment is a certain percentage of the fair market value that is determined by local assessors to be the total taxable value of land and additions on the property. | Land | Improvement |
|---|---|---|---|---|
| 2025 | $3,561 | $221,745 | $27,455 | $193,807 |
| 2024 | $1,089 | $225,123 | $23,317 | $201,232 |
| 2023 | $1,089 | $52,724 | $0 | $0 |
| 2022 | $995 | $51,188 | $0 | $0 |
| 2021 | $920 | $140,405 | $8,500 | $131,905 |
| 2020 | $910 | $49,011 | $0 | $0 |
| 2019 | $952 | $47,909 | $0 | $0 |
| 2018 | $918 | $47,016 | $0 | $0 |
| 2017 | $873 | $46,049 | $0 | $0 |
| 2016 | $834 | $93,192 | $5,405 | $87,787 |
| 2015 | $823 | $77,402 | $4,700 | $72,702 |
| 2014 | $645 | $72,808 | $3,870 | $68,938 |
| 2013 | -- | $59,602 | $3,400 | $56,202 |
Source: Public Records
Map
Nearby Homes
- 707 Cortez Ave
- 903 W 7th St
- 15 W 7th St
- 618 Edison Ave Lehigh Acres
- 718 Willard Ave
- 616 Edison Ave Lehigh Acres
- 802 Poinsettia Ave
- 16 W 7th St
- 406 E 9th St
- 614 Plumosa Ave
- 710 Desoto Ave
- 715 Mckinley Ave
- 17 W 9th St
- 404 W 6th St
- 612 Poinsettia Ave
- 12 W 9th St
- 818 Desoto Ave
- 904 Poinsettia Ave
- 706 Mckinley Ave
- 200 W 6th St
- 720 Edison Ave
- 717 Cortez Ave
- 719 Edison Ave
- 715 Edison Ave
- 713 Cortez Ave
- 710 Edison Ave
- 711 Cortez Ave
- 720 Prospect Ave
- 711 Edison Ave
- 402 W 8th St
- 714 Prospect Ave
- 714 Cortez Ave
- 206 W 8th St
- 709 Cortez Ave
- 710 Prospect Ave
- 710 Prospect Ave
- 706 Edison Ave
- 710 Cortez Ave
- 406 W 8th St
- 721 Plumosa Ave Unit 10