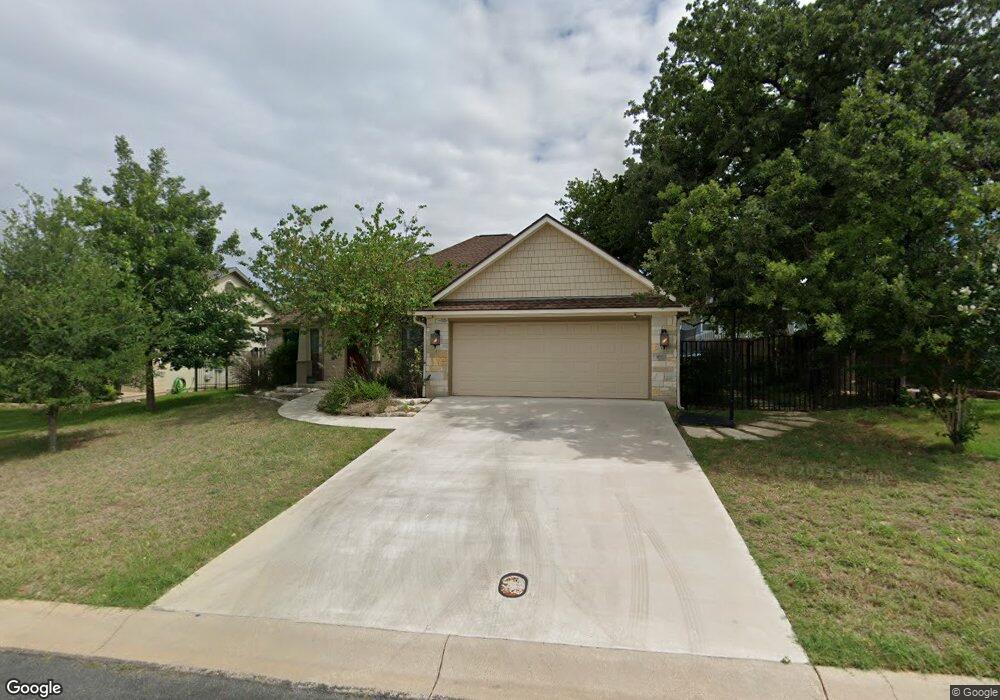
718 Englemann Oak Dr Unit 93 Fredericksburg, TX 78624
Estimated Value: $371,000 - $534,000
--
Bed
--
Bath
1,509
Sq Ft
$293/Sq Ft
Est. Value
About This Home
This home is located at 718 Englemann Oak Dr Unit 93, Fredericksburg, TX 78624 and is currently estimated at $442,151, approximately $293 per square foot. 718 Englemann Oak Dr Unit 93 is a home located in Gillespie County with nearby schools including Fredericksburg High School, St. Mary's Catholic School, and Ambleside School of Fredericksburg.
Ownership History
Date
Name
Owned For
Owner Type
Purchase Details
Closed on
Jun 3, 2016
Sold by
Jayson Laurie B and Benedict Lorraine L
Bought by
Lang Richard H and Lang Amanda A
Current Estimated Value
Home Financials for this Owner
Home Financials are based on the most recent Mortgage that was taken out on this home.
Original Mortgage
$267,093
Outstanding Balance
$212,138
Interest Rate
3.59%
Mortgage Type
New Conventional
Estimated Equity
$230,013
Purchase Details
Closed on
Dec 18, 2015
Sold by
Coleman Eric S and Coleman Jeannie K
Bought by
Furr Collin D
Home Financials for this Owner
Home Financials are based on the most recent Mortgage that was taken out on this home.
Original Mortgage
$152,000
Interest Rate
4.03%
Mortgage Type
Purchase Money Mortgage
Purchase Details
Closed on
Dec 14, 2012
Sold by
Howard Rebecca
Bought by
Jayson Laurie B and Benedict Lorraine L
Home Financials for this Owner
Home Financials are based on the most recent Mortgage that was taken out on this home.
Original Mortgage
$198,341
Interest Rate
3.37%
Mortgage Type
FHA
Create a Home Valuation Report for This Property
The Home Valuation Report is an in-depth analysis detailing your home's value as well as a comparison with similar homes in the area
Home Values in the Area
Average Home Value in this Area
Purchase History
| Date | Buyer | Sale Price | Title Company |
|---|---|---|---|
| Lang Richard H | -- | None Available | |
| Furr Collin D | -- | None Available | |
| Jayson Laurie B | -- | None Available |
Source: Public Records
Mortgage History
| Date | Status | Borrower | Loan Amount |
|---|---|---|---|
| Open | Lang Richard H | $267,093 | |
| Previous Owner | Furr Collin D | $152,000 | |
| Previous Owner | Jayson Laurie B | $198,341 |
Source: Public Records
Tax History Compared to Growth
Tax History
| Year | Tax Paid | Tax Assessment Tax Assessment Total Assessment is a certain percentage of the fair market value that is determined by local assessors to be the total taxable value of land and additions on the property. | Land | Improvement |
|---|---|---|---|---|
| 2025 | $5,849 | $467,210 | $108,940 | $358,270 |
| 2024 | $5,849 | $460,390 | $108,940 | $351,450 |
| 2023 | $5,640 | $460,390 | $108,940 | $351,450 |
| 2022 | $5,350 | $357,960 | $60,480 | $297,480 |
| 2021 | $5,556 | $329,390 | $59,730 | $269,660 |
| 2020 | $5,135 | $298,150 | $56,350 | $241,800 |
| 2019 | $5,266 | $294,690 | $52,890 | $241,800 |
| 2018 | $4,873 | $273,910 | $51,390 | $222,520 |
| 2017 | $4,746 | $259,560 | $46,880 | $212,680 |
| 2016 | $4,151 | $227,010 | $46,880 | $180,130 |
| 2015 | -- | $214,100 | $44,330 | $169,770 |
| 2014 | -- | $189,910 | $38,320 | $151,590 |
Source: Public Records
Map
Nearby Homes
- 717 Chinkapin Dr
- 707 Chinkapin Dr
- 713 Englemann Oak Dr
- 711 Englemann Oak Dr
- 720 Darlington Dr
- 808 Gray Oak Ct
- 602 Atkins Ct Unit 111
- 608 Gibson Ct Unit 107
- 608 Gibson Ct
- 601 Atkins Ct Unit 113
- 1104 Post Oak Rd Unit 17
- 204 Green Meadows Ln
- 508 Winding Way
- 201 Green Oaks Loop
- 502 Winding Way
- 271 Smokehouse Rd
- 455 Summit Cir
- 111 Green Meadows Blvd
- 60 Ale Ct
- 67 Sky Ln
- 718 Englemann Oak Dr
- 716 Englemann Oak Dr Unit 92
- 716 Englemann Oak Dr
- 720 Englemann Oak Dr
- 720 Englemann Oak Dr Unit 94
- 717 Emory Dr
- 715 Emory Dr Unit 116
- 715 Emory Dr
- 221 Englemann Oak Dr Unit 95
- 714 Englemann Oak Dr Unit 91
- 717 Englemann Oak Dr
- 717 Englemann Oak Dr Unit 76
- 722 Englemann Oak Dr Unit 95
- 722 Englemann Oak Dr
- 719 Emory Dr Unit 114
- 719 Emory Dr
- 713 Emory Dr Unit 117
- 713 Emory Dr
- 715 Englemann Oak Dr
- 715 Englemann Oak Dr Unit 77