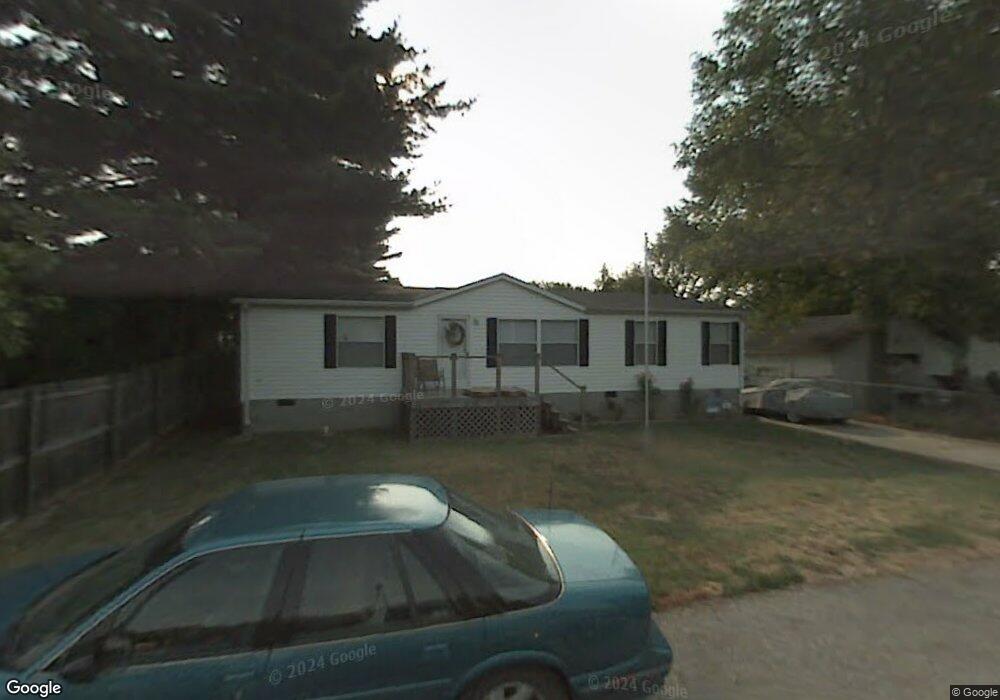
718 Filmore St Newburgh, IN 47630
Estimated Value: $170,000 - $212,000
3
Beds
2
Baths
1,248
Sq Ft
$153/Sq Ft
Est. Value
About This Home
This home is located at 718 Filmore St, Newburgh, IN 47630 and is currently estimated at $190,470, approximately $152 per square foot. 718 Filmore St is a home located in Warrick County with nearby schools including Newburgh Elementary School, Castle North Middle School, and Castle High School.
Ownership History
Date
Name
Owned For
Owner Type
Purchase Details
Closed on
Jun 29, 2009
Sold by
Smith Erik J and Smith Sarah L
Bought by
Morrow Bryan Lee
Current Estimated Value
Home Financials for this Owner
Home Financials are based on the most recent Mortgage that was taken out on this home.
Original Mortgage
$76,095
Outstanding Balance
$50,441
Interest Rate
5.62%
Mortgage Type
FHA
Estimated Equity
$140,029
Create a Home Valuation Report for This Property
The Home Valuation Report is an in-depth analysis detailing your home's value as well as a comparison with similar homes in the area
Home Values in the Area
Average Home Value in this Area
Purchase History
| Date | Buyer | Sale Price | Title Company |
|---|---|---|---|
| Morrow Bryan Lee | -- | None Available |
Source: Public Records
Mortgage History
| Date | Status | Borrower | Loan Amount |
|---|---|---|---|
| Open | Morrow Bryan Lee | $76,095 |
Source: Public Records
Tax History Compared to Growth
Tax History
| Year | Tax Paid | Tax Assessment Tax Assessment Total Assessment is a certain percentage of the fair market value that is determined by local assessors to be the total taxable value of land and additions on the property. | Land | Improvement |
|---|---|---|---|---|
| 2024 | $1,075 | $135,600 | $37,700 | $97,900 |
| 2023 | $994 | $134,300 | $37,700 | $96,600 |
| 2022 | $698 | $105,600 | $13,700 | $91,900 |
| 2021 | $497 | $84,500 | $11,400 | $73,100 |
| 2020 | $452 | $81,300 | $11,400 | $69,900 |
| 2019 | $438 | $80,200 | $11,400 | $68,800 |
| 2018 | $417 | $78,800 | $11,400 | $67,400 |
| 2017 | $392 | $76,700 | $11,400 | $65,300 |
| 2016 | $388 | $76,700 | $11,400 | $65,300 |
Source: Public Records
Map
Nearby Homes
- 519 Monroe St
- 405 Middle St
- 1060 Jefferson Ct
- 110 Monroe St
- 223 W Jennings St
- 116 Sycamore St
- 210 E Main St
- 422 W Water St
- 317 W Water St
- 101 E Jennings St Unit E
- 5599 Victoria Ct
- 700 Coppers Edge Dr
- 8634 Briarose Ct
- 0 Phelps Dr
- 0 Willow Pond Rd
- 105 Temple
- 912 Orchard Dr
- 5610 Saint Catherine Ct
- 213 Westbriar Blvd
- 7711 Woodland Dr
- 114 4th St
- 628 Monroe St
- 202 4th St
- 626 Monroe St
- 0 Park Place Dr Unit LOT 10 807211
- 0 Park Place Dr Unit LOT 8 807210
- 0 Park Place Dr Unit LOT 7 807209
- 0 Park Place Dr Unit LOT 6
- 12 Park Place Dr
- 13 Park Place Dr
- 0 Park Place Dr Unit LOT 7 948603
- 0 Park Place Dr Unit LOT 8 947676
- 0 Park Place Dr Unit LOT 10 947663
- 0 Park Place Dr Unit LOT 6 947662
- 624 Monroe St
- 203 4th St
- 627 Monroe St
- 625 Monroe St
- 629 Monroe St
- 206 4th St