Estimated Value: $215,000 - $258,000
3
Beds
2
Baths
1,500
Sq Ft
$160/Sq Ft
Est. Value
About This Home
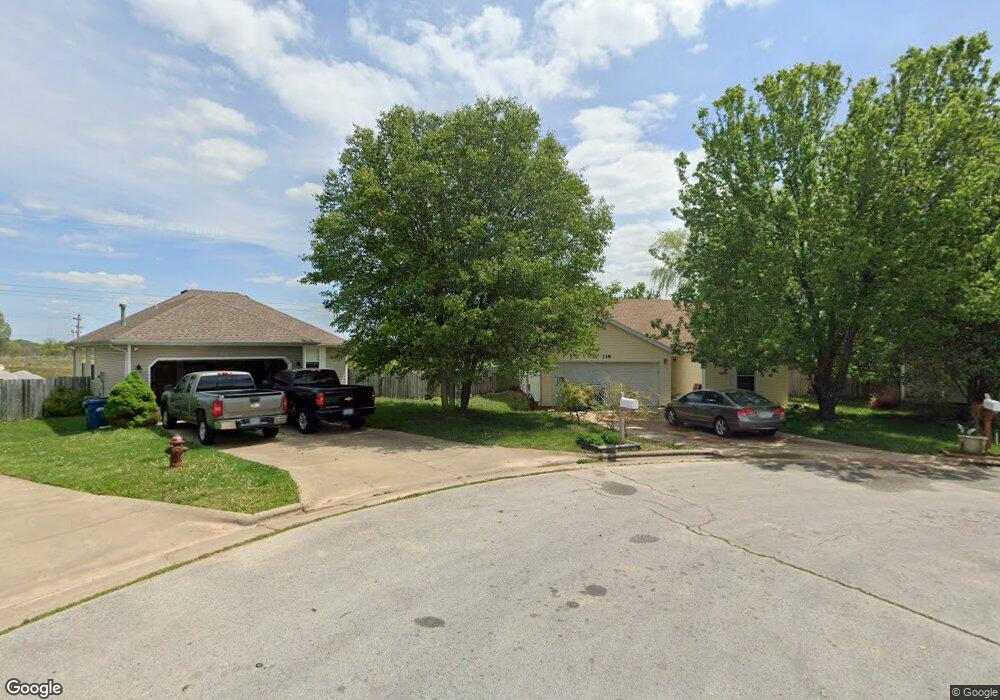
This home is located at 718 Mimosa Ct, Nixa, MO 65714 and is currently estimated at $239,527, approximately $159 per square foot. 718 Mimosa Ct is a home located in Christian County with nearby schools including Mathews Elementary School, Nixa Junior High School, and Nicholas A. Inman Intermediate School.
Ownership History
Date
Name
Owned For
Owner Type
Purchase Details
Closed on
Aug 8, 2014
Sold by
Deese Jason W and Deese Emily R
Bought by
718 W Mimosa Ct Family Trust
Current Estimated Value
Purchase Details
Closed on
Mar 26, 2010
Sold by
Hefner Carl and Hefner Carolyn
Bought by
Deese Jason W
Home Financials for this Owner
Home Financials are based on the most recent Mortgage that was taken out on this home.
Original Mortgage
$113,386
Interest Rate
4.96%
Mortgage Type
VA
Purchase Details
Closed on
Nov 3, 2009
Sold by
Jarvis Michelle E and Allen Michell E
Bought by
Hefner Carl and Hefner Carolyn
Purchase Details
Closed on
May 12, 2006
Sold by
Thompson Jason M and Thompson Georgina
Bought by
Allen Michelle E and Jarvis Jason L
Home Financials for this Owner
Home Financials are based on the most recent Mortgage that was taken out on this home.
Original Mortgage
$102,150
Interest Rate
6.5%
Mortgage Type
New Conventional
Create a Home Valuation Report for This Property
The Home Valuation Report is an in-depth analysis detailing your home's value as well as a comparison with similar homes in the area
Home Values in the Area
Average Home Value in this Area
Purchase History
| Date | Buyer | Sale Price | Title Company |
|---|---|---|---|
| 718 W Mimosa Ct Family Trust | -- | Great American Title | |
| Deese Jason W | -- | None Available | |
| Hefner Carl | -- | None Available | |
| Allen Michelle E | -- | None Available |
Source: Public Records
Mortgage History
| Date | Status | Borrower | Loan Amount |
|---|---|---|---|
| Previous Owner | Deese Jason W | $113,386 | |
| Previous Owner | Allen Michelle E | $102,150 |
Source: Public Records
Tax History
| Year | Tax Paid | Tax Assessment Tax Assessment Total Assessment is a certain percentage of the fair market value that is determined by local assessors to be the total taxable value of land and additions on the property. | Land | Improvement |
|---|---|---|---|---|
| 2025 | $1,487 | $25,270 | -- | -- |
| 2024 | $1,487 | $23,860 | -- | -- |
| 2023 | $1,487 | $23,860 | $0 | $0 |
| 2022 | $1,299 | $20,820 | $0 | $0 |
| 2021 | $1,300 | $20,820 | $0 | $0 |
| 2020 | $1,172 | $17,920 | $0 | $0 |
| 2019 | $1,172 | $17,920 | $0 | $0 |
| 2018 | $1,092 | $17,920 | $0 | $0 |
| 2017 | $1,092 | $17,920 | $0 | $0 |
| 2016 | $1,075 | $17,920 | $0 | $0 |
| 2015 | $1,077 | $17,920 | $17,920 | $0 |
| 2014 | $1,047 | $17,860 | $0 | $0 |
| 2013 | $10 | $17,670 | $0 | $0 |
| 2011 | $10 | $35,340 | $0 | $0 |
Source: Public Records
Map
Nearby Homes
- 752 W Mimosa Ct
- 1280 W Butterfield Dr
- 867 S Irontree Ct
- 955 S Silverwood Ln
- 915 S Silverwood Ln
- 911 S Silverwood Ln
- 919 S Silverwood Ln
- 788 S Hackberry Ave
- 649 W Arbor Glenn Dr
- 907 S Silverwood Ln
- 985 W Pembrook Ave
- 667 W Castor
- 687 W Castor Loop
- 673 W Castor Loop
- 689 W Castor Loop
- 660 W Castor Loop
- 659 W Castor Loop
- 643 W Brook Hollow Rd
- 652 W Castor Loop
- 649 W Brook Hollow Rd
- 722 W Mimosa Ct
- 711 Mimosa Ct
- 721 Mimosa Ct
- 732 Mimosa Ct
- 731 W Mimosa Ct
- 731 W Mimosa Ct
- 731 Mimosa Ct
- 742 W Mimosa Ct
- 752 Mimosa Ct
- 833 S Silverwood Ln
- 826 S Chinkapin Ave
- 845 S Silverwood Ln
- 827 S Silverwood Ln
- 711 W Butterfield Dr
- 764 W Mimosa Ct
- 701 Butterfield Dr
- 701 W Butterfield Dr
- 721 Butterfield Dr
- 850 S Hackberry Ave
- 881 W Butterfield Dr
Your Personal Tour Guide
Ask me questions while you tour the home.