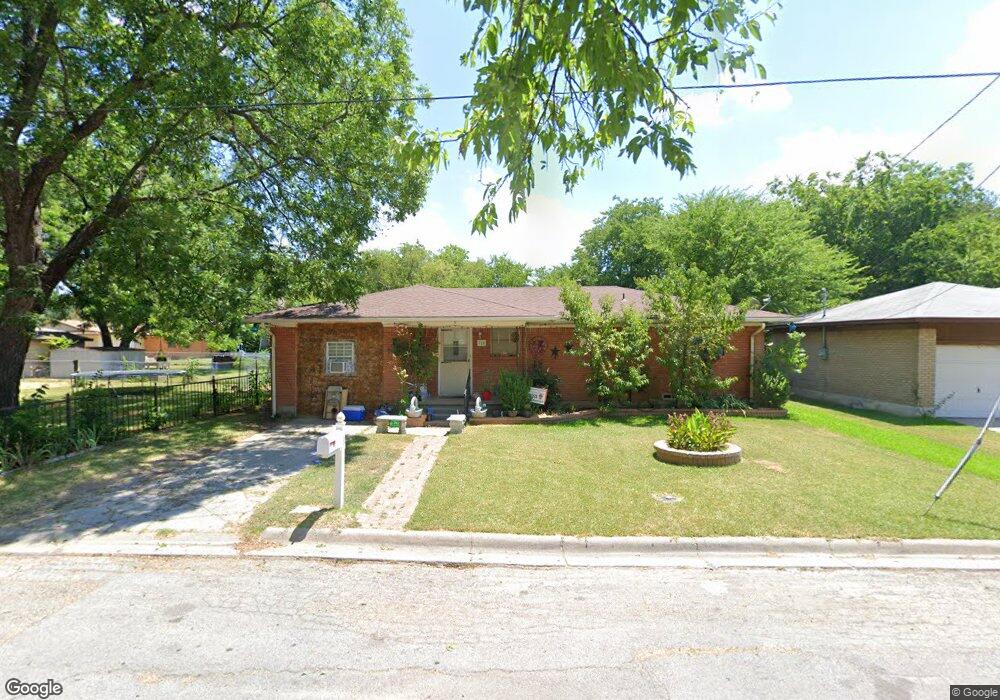
718 N Howeth St Gainesville, TX 76240
Estimated Value: $178,252 - $212,000
2
Beds
2
Baths
1,207
Sq Ft
$156/Sq Ft
Est. Value
About This Home
This home is located at 718 N Howeth St, Gainesville, TX 76240 and is currently estimated at $188,813, approximately $156 per square foot. 718 N Howeth St is a home located in Cooke County with nearby schools including Edison Elementary School, W.E. Chalmers Elementary School, and Gainesville Intermediate School.
Ownership History
Date
Name
Owned For
Owner Type
Purchase Details
Closed on
Jan 25, 2016
Sold by
Secretary Of Housing And Urban Developme
Bought by
Broadway Productions Inc
Current Estimated Value
Home Financials for this Owner
Home Financials are based on the most recent Mortgage that was taken out on this home.
Original Mortgage
$46,400
Outstanding Balance
$36,865
Interest Rate
4.01%
Mortgage Type
Purchase Money Mortgage
Estimated Equity
$151,948
Purchase Details
Closed on
Apr 7, 2015
Sold by
Olver Raul and Olvepa Marina Guadalupe
Bought by
Pennymac Loan Services Llc
Purchase Details
Closed on
Feb 5, 2008
Sold by
Wright Hubert W and Wright Ona Jane
Bought by
Olvera Raul and Olivera Marina Gaadalupe
Home Financials for this Owner
Home Financials are based on the most recent Mortgage that was taken out on this home.
Original Mortgage
$77,016
Interest Rate
6.15%
Create a Home Valuation Report for This Property
The Home Valuation Report is an in-depth analysis detailing your home's value as well as a comparison with similar homes in the area
Home Values in the Area
Average Home Value in this Area
Purchase History
| Date | Buyer | Sale Price | Title Company |
|---|---|---|---|
| Broadway Productions Inc | -- | None Available | |
| Pennymac Loan Services Llc | $67,890 | None Available | |
| Olvera Raul | -- | -- |
Source: Public Records
Mortgage History
| Date | Status | Borrower | Loan Amount |
|---|---|---|---|
| Open | Broadway Productions Inc | $46,400 | |
| Previous Owner | Olvera Raul | $77,016 |
Source: Public Records
Tax History Compared to Growth
Tax History
| Year | Tax Paid | Tax Assessment Tax Assessment Total Assessment is a certain percentage of the fair market value that is determined by local assessors to be the total taxable value of land and additions on the property. | Land | Improvement |
|---|---|---|---|---|
| 2025 | $3,050 | $160,957 | $29,304 | $131,653 |
| 2024 | $3,050 | $160,957 | $29,304 | $131,653 |
| 2023 | $3,314 | $168,918 | $26,640 | $142,278 |
| 2022 | $3,175 | $145,820 | $23,760 | $122,060 |
| 2021 | $2,813 | $109,241 | $15,840 | $93,401 |
| 2020 | $2,676 | $100,775 | $15,120 | $85,655 |
| 2019 | $1,977 | $72,333 | $15,120 | $57,213 |
| 2018 | $1,625 | $59,541 | $7,560 | $51,981 |
| 2017 | $1,553 | $57,126 | $7,560 | $49,566 |
| 2015 | $1,777 | $74,563 | $7,560 | $67,003 |
| 2014 | $1,777 | $73,978 | $7,560 | $66,418 |
Source: Public Records
Map
Nearby Homes
- 1520 Olive St
- 705 Fair Ave
- 805 Ritchey St
- 811 Ritchey St
- 1016 N Howeth St
- 608 Ritchey St
- 1102 Fair Ave
- 802 Myrtle St
- 901 N Morris St
- 1113 Fair Ave
- 1907 Woodlawn Ct
- 418 Hillside Dr
- 00 O'Neal St
- Lot #2 Belcher St
- Lot #1 Belcher St
- Lot #3 Belcher St
- 316 Ritchey St
- 1109 Elmwood St
- 313 Fair Ave
- 2002 Everglade Dr
- 716 N Howeth St
- 1600 Elizabeth St
- 712 N Howeth St
- 1602 Elizabeth St
- 1604 Elizabeth St
- 1506 Elizabeth St
- 715 N Howeth St
- 1608 Elizabeth St
- 1504 Elizabeth St
- 711 N Howeth St
- 1610 Elizabeth St
- 1601 Belcher St
- 732 Cunningham St
- 1603 Belcher St
- 728 Cunningham St
- 1502 Elizabeth St
- 720 Cunningham St
- 1511 Belcher St
- 1605 Elizabeth St
- 1601 Elizabeth St