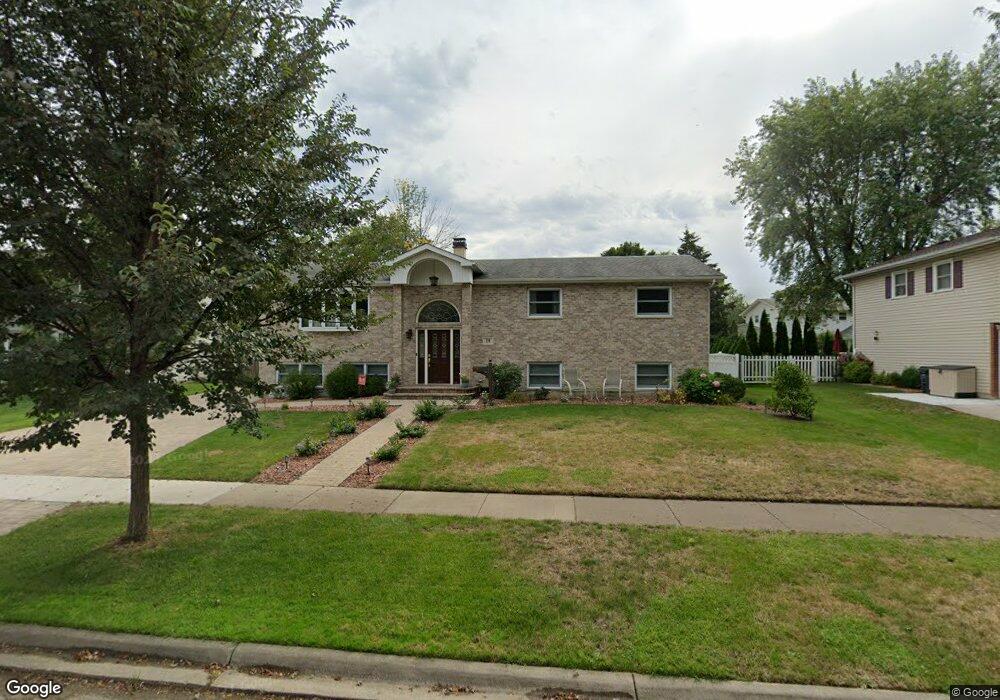
718 N Whitcomb Dr Palatine, IL 60074
Winston Park NeighborhoodEstimated Value: $408,000 - $490,000
4
Beds
4
Baths
1,521
Sq Ft
$304/Sq Ft
Est. Value
About This Home
This home is located at 718 N Whitcomb Dr, Palatine, IL 60074 and is currently estimated at $462,565, approximately $304 per square foot. 718 N Whitcomb Dr is a home located in Cook County with nearby schools including Jane Addams Elementary School, Palatine High School, and St Thomas Of Villanova School.
Ownership History
Date
Name
Owned For
Owner Type
Purchase Details
Closed on
Jun 26, 2017
Sold by
Clough Pamela Jean and Clough Robert Nelson
Bought by
Clough Robert Nelson and Clough Pamela Jean
Current Estimated Value
Purchase Details
Closed on
Mar 26, 1999
Sold by
Royce Richard A
Bought by
Weis William J and Nordlander Weis Pamela J
Home Financials for this Owner
Home Financials are based on the most recent Mortgage that was taken out on this home.
Original Mortgage
$133,975
Outstanding Balance
$33,643
Interest Rate
6.94%
Estimated Equity
$428,922
Purchase Details
Closed on
Jul 15, 1995
Sold by
Killian Stephen D and Killian Leslye C
Bought by
Royce Richard A
Home Financials for this Owner
Home Financials are based on the most recent Mortgage that was taken out on this home.
Original Mortgage
$133,500
Interest Rate
7.51%
Create a Home Valuation Report for This Property
The Home Valuation Report is an in-depth analysis detailing your home's value as well as a comparison with similar homes in the area
Home Values in the Area
Average Home Value in this Area
Purchase History
| Date | Buyer | Sale Price | Title Company |
|---|---|---|---|
| Clough Robert Nelson | -- | Attorney | |
| Weis William J | $185,000 | Land Title Group Inc | |
| Royce Richard A | $176,000 | -- |
Source: Public Records
Mortgage History
| Date | Status | Borrower | Loan Amount |
|---|---|---|---|
| Open | Weis William J | $133,975 | |
| Previous Owner | Royce Richard A | $133,500 |
Source: Public Records
Tax History Compared to Growth
Tax History
| Year | Tax Paid | Tax Assessment Tax Assessment Total Assessment is a certain percentage of the fair market value that is determined by local assessors to be the total taxable value of land and additions on the property. | Land | Improvement |
|---|---|---|---|---|
| 2024 | $8,492 | $32,000 | $6,739 | $25,261 |
| 2023 | $8,185 | $32,000 | $6,739 | $25,261 |
| 2022 | $8,185 | $32,000 | $6,739 | $25,261 |
| 2021 | $7,170 | $25,407 | $4,212 | $21,195 |
| 2020 | $7,136 | $25,407 | $4,212 | $21,195 |
| 2019 | $7,158 | $28,388 | $4,212 | $24,176 |
| 2018 | $7,874 | $28,771 | $3,790 | $24,981 |
| 2017 | $7,743 | $28,771 | $3,790 | $24,981 |
| 2016 | $7,450 | $28,771 | $3,790 | $24,981 |
| 2015 | $6,742 | $24,567 | $3,369 | $21,198 |
| 2014 | $6,677 | $24,567 | $3,369 | $21,198 |
| 2013 | $6,488 | $24,567 | $3,369 | $21,198 |
Source: Public Records
Map
Nearby Homes
- 1133 E Sayles Dr
- 1163 E Plate Dr
- 1239 E Carpenter Dr
- 1040 E Grissom Dr
- 1092 E Cottonwood Way
- 642 N Victoria Dr
- 1329 E Evergreen Dr Unit 1
- 856 E Cooper Dr
- 847 E Cooper Dr
- 315 N Lytle Dr
- 461 N Jonathan Dr Unit 461202
- 1408 E Reynolds Dr Unit 1
- 1149 N Cardinal Dr
- 1426 E Anderson Dr
- 915 N Saratoga Dr
- 306 N Bissell Dr
- 1113 E Randville Dr
- 1137 N Claremont Dr Unit 1737
- 1131 N Claremont Dr Unit 1617
- 1319 N Winslowe Dr Unit 303
- 714 N Whitcomb Dr Unit 3
- 722 N Whitcomb Dr
- 1142 E Sayles Dr
- 1150 E Sayles Dr
- 727 N Whitcomb Dr
- 1136 E Sayles Dr
- 710 N Whitcomb Dr
- 726 N Whitcomb Dr
- 1158 E Sayles Dr
- 725 N Whitcomb Dr
- 729 N Whitcomb Dr
- 721 N Whitcomb Dr
- 1128 E Sayles Dr
- 735 N Whitcomb Dr
- 730 N Whitcomb Dr
- 706 N Whitcomb Dr
- 1200 E Sayles Dr
- 1141 E Sayles Dr
- 742 N Williams Dr
- 1149 E Sayles Dr