Estimated Value: $281,091 - $317,000
4
Beds
3
Baths
2,536
Sq Ft
$119/Sq Ft
Est. Value
About This Home
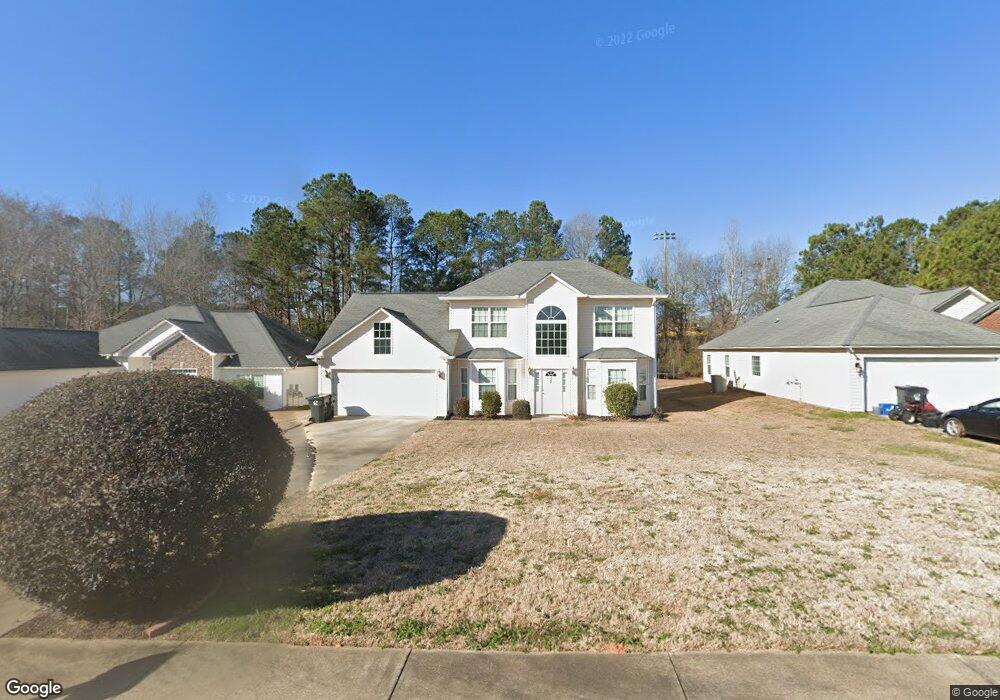
This home is located at 718 Natures Walk, Gray, GA 31032 and is currently estimated at $302,273, approximately $119 per square foot. 718 Natures Walk is a home located in Jones County with nearby schools including Gray Elementary School, Gray Station Middle School, and Jones County High School.
Ownership History
Date
Name
Owned For
Owner Type
Purchase Details
Closed on
May 21, 2010
Sold by
Dixon Kimim
Bought by
Page Romondo A
Current Estimated Value
Home Financials for this Owner
Home Financials are based on the most recent Mortgage that was taken out on this home.
Original Mortgage
$146,000
Outstanding Balance
$96,627
Interest Rate
5.03%
Mortgage Type
VA
Estimated Equity
$205,646
Purchase Details
Closed on
Jul 29, 2008
Sold by
Colonial Bank
Bought by
Dixon Kimim
Home Financials for this Owner
Home Financials are based on the most recent Mortgage that was taken out on this home.
Original Mortgage
$124,053
Interest Rate
6.31%
Mortgage Type
New Conventional
Purchase Details
Closed on
Mar 4, 2008
Sold by
M H Designs Inc
Bought by
Colonial Bank
Purchase Details
Closed on
Dec 2, 2005
Sold by
Milholen Properties Inc
Bought by
M & H Designs Inc
Purchase Details
Closed on
Nov 30, 2005
Sold by
Jm Land Holding Co Inc
Bought by
Milholen Properties Inc
Create a Home Valuation Report for This Property
The Home Valuation Report is an in-depth analysis detailing your home's value as well as a comparison with similar homes in the area
Home Values in the Area
Average Home Value in this Area
Purchase History
| Date | Buyer | Sale Price | Title Company |
|---|---|---|---|
| Page Romondo A | $146,000 | -- | |
| Page Romondo A | $146,000 | -- | |
| Dixon Kimim | $126,000 | -- | |
| Colonial Bank | -- | -- | |
| M & H Designs Inc | $360,000 | -- | |
| Milholen Properties Inc | -- | -- |
Source: Public Records
Mortgage History
| Date | Status | Borrower | Loan Amount |
|---|---|---|---|
| Open | Page Romondo A | $146,000 | |
| Closed | Page Romondo A | $146,000 | |
| Previous Owner | Dixon Kimim | $124,053 |
Source: Public Records
Tax History
| Year | Tax Paid | Tax Assessment Tax Assessment Total Assessment is a certain percentage of the fair market value that is determined by local assessors to be the total taxable value of land and additions on the property. | Land | Improvement |
|---|---|---|---|---|
| 2025 | $4,414 | $107,217 | $10,000 | $97,217 |
| 2023 | $1,671 | $65,990 | $6,800 | $59,190 |
| 2022 | $2,223 | $63,270 | $4,080 | $59,190 |
| 2021 | $2,226 | $63,270 | $4,080 | $59,190 |
| 2020 | $2,227 | $63,270 | $4,080 | $59,190 |
| 2019 | $2,227 | $63,270 | $4,080 | $59,190 |
| 2018 | $2,201 | $62,590 | $3,400 | $59,190 |
| 2017 | $2,179 | $61,990 | $2,800 | $59,190 |
| 2016 | $2,179 | $61,990 | $2,800 | $59,190 |
| 2015 | $2,062 | $61,990 | $2,800 | $59,190 |
| 2014 | $1,911 | $61,990 | $2,800 | $59,190 |
Source: Public Records
Map
Nearby Homes
- 854 Natures Walk
- 238 Hidden Lakes Dr
- 146 Overland Way
- 118 Allan Green Dr
- 203 Hidden Lakes Dr
- 303 Ruby Ct
- 219 Diamond Place
- 737 Springhill Dr
- 0 Bill Conn Pkwy
- 801 Holly Ridge Dr
- 128 Piedmont Lake Dr
- 000 Walnut Grove Rd
- 0 Walnut Grove Rd Unit 10697101
- 00 Walnut Grove Rd
- 314 Walnut Grove Rd
- 0 Walnut Grove Rd Unit 10697107
- 0 Walnut Grove Rd Unit 183246
- 184 Stone Brooke Dr
- 251 Autumn Ridge Ct
- 122 Oak Dr
- 722 Natures Walk
- 714 Natures Walk
- 710 Natures Walk
- 706 Natures Walk
- 725 Natures Walk
- 717 Natures Walk
- 702 Natures Walk
- 721 Natures Walk
- 713 Natures Walk
- 713 Natures Walk
- 698 Natures Walk
- 709 Natures Walk
- 729 Natures Walk
- 705 Natures Walk
- 733 Natures Walk
- 701 Natures Walk
- 746 Natures Walk
- 690 Natures Walk
- 877 Natures Walk
- 865 Natures Walk
Your Personal Tour Guide
Ask me questions while you tour the home.