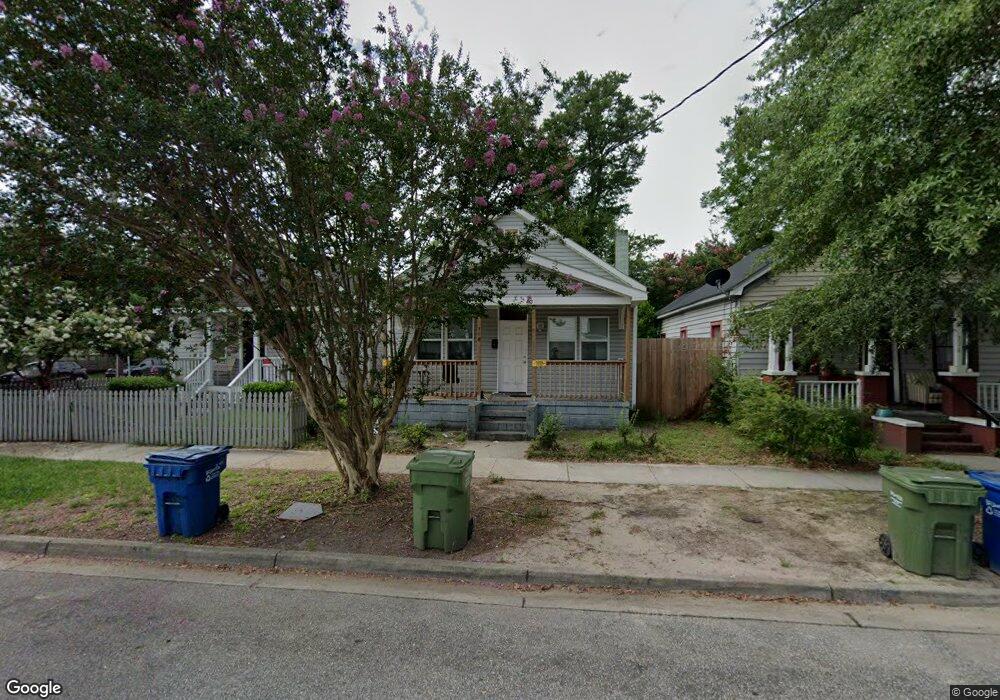
718 Queen St Wilmington, NC 28401
Dry Pond-South Side NeighborhoodEstimated Value: $228,000 - $261,000
2
Beds
1
Bath
828
Sq Ft
$293/Sq Ft
Est. Value
About This Home
This home is located at 718 Queen St, Wilmington, NC 28401 and is currently estimated at $242,609, approximately $293 per square foot. 718 Queen St is a home located in New Hanover County with nearby schools including Snipes Academy of Arts & Design, Williston Middle School, and John T. Hoggard High School.
Ownership History
Date
Name
Owned For
Owner Type
Purchase Details
Closed on
May 18, 2022
Sold by
Gemelli Peter E and Gemelli Megan E
Bought by
Two Bros Homes Llc
Current Estimated Value
Purchase Details
Closed on
Mar 13, 2019
Sold by
D & P Property Solutions Llc
Bought by
Gemelli Peter
Purchase Details
Closed on
Sep 21, 2009
Sold by
Real Properties Llc
Bought by
D & P Property Solutions Llc
Purchase Details
Closed on
Sep 19, 2005
Sold by
Mclean Magnolia H
Bought by
Real Properties Llc
Purchase Details
Closed on
Apr 20, 1999
Sold by
Greene Wilbur A Janie L
Bought by
Mclean Magnolia H
Purchase Details
Closed on
Mar 21, 1996
Sold by
Greene Jr Jerry H
Bought by
Greene Wilbur A Janie L
Purchase Details
Closed on
Mar 20, 1995
Sold by
Greene Violet P
Bought by
Green Jerry H
Purchase Details
Closed on
Dec 1, 1981
Sold by
Greene Jr Jerry Harvester
Bought by
Greene Wilbur A Violet P
Purchase Details
Closed on
Aug 1, 1970
Bought by
Greene Jerry Harvester
Create a Home Valuation Report for This Property
The Home Valuation Report is an in-depth analysis detailing your home's value as well as a comparison with similar homes in the area
Home Values in the Area
Average Home Value in this Area
Purchase History
| Date | Buyer | Sale Price | Title Company |
|---|---|---|---|
| Two Bros Homes Llc | -- | Bailey & Busby Pllc | |
| Gemelli Peter | $260,000 | None Available | |
| D & P Property Solutions Llc | $364,000 | None Available | |
| Real Properties Llc | $40,000 | None Available | |
| Mclean Magnolia H | $18,000 | -- | |
| Greene Wilbur A Janie L | -- | -- | |
| Green Jerry H | -- | -- | |
| Greene Wilbur A Violet P | $1,500 | -- | |
| Greene Jerry Harvester | $1,500 | -- |
Source: Public Records
Tax History Compared to Growth
Tax History
| Year | Tax Paid | Tax Assessment Tax Assessment Total Assessment is a certain percentage of the fair market value that is determined by local assessors to be the total taxable value of land and additions on the property. | Land | Improvement |
|---|---|---|---|---|
| 2025 | $1,461 | $248,200 | $96,000 | $152,200 |
| 2023 | $1,101 | $126,600 | $46,600 | $80,000 |
| 2022 | $1,076 | $126,600 | $46,600 | $80,000 |
| 2021 | $1,083 | $126,600 | $46,600 | $80,000 |
| 2020 | $431 | $40,900 | $10,300 | $30,600 |
| 2019 | $431 | $40,900 | $10,300 | $30,600 |
| 2018 | $431 | $40,900 | $10,300 | $30,600 |
| 2017 | $431 | $40,900 | $10,300 | $30,600 |
| 2016 | $403 | $36,400 | $16,600 | $19,800 |
| 2015 | $385 | $36,400 | $16,600 | $19,800 |
| 2014 | $369 | $36,400 | $16,600 | $19,800 |
Source: Public Records
Map
Nearby Homes