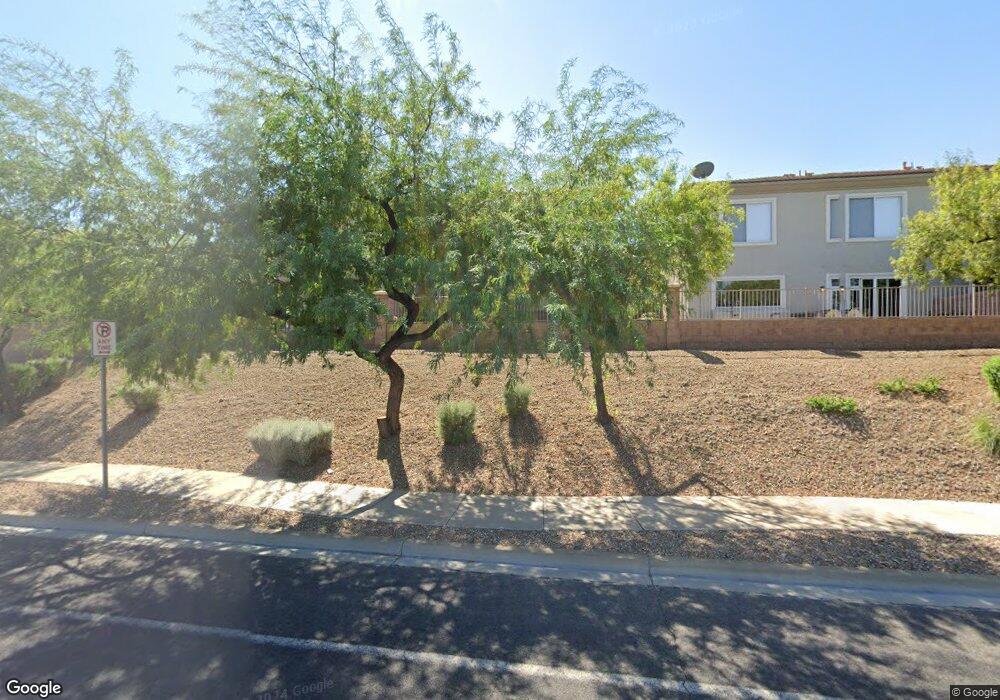
718 Solitude Point Ave Unit 1 Henderson, NV 89012
McCullough Hills NeighborhoodEstimated Value: $380,681 - $393,000
2
Beds
3
Baths
1,422
Sq Ft
$271/Sq Ft
Est. Value
About This Home
This home is located at 718 Solitude Point Ave Unit 1, Henderson, NV 89012 and is currently estimated at $385,920, approximately $271 per square foot. 718 Solitude Point Ave Unit 1 is a home located in Clark County with nearby schools including Ulis Newton Elementary School, Jack & Terry Mannion Middle School, and Foothill High School.
Ownership History
Date
Name
Owned For
Owner Type
Purchase Details
Closed on
Sep 12, 2011
Sold by
Fazio Michael A
Bought by
Wilkes Thomas and Campbell Sherry
Current Estimated Value
Home Financials for this Owner
Home Financials are based on the most recent Mortgage that was taken out on this home.
Original Mortgage
$93,627
Outstanding Balance
$63,608
Interest Rate
4.4%
Mortgage Type
FHA
Estimated Equity
$322,312
Purchase Details
Closed on
Apr 20, 2011
Sold by
Fazio Michael and Fazio Sandra
Bought by
Fazio Michael A
Purchase Details
Closed on
Feb 11, 2008
Sold by
Fazio Michael
Bought by
Fazio Michael and Fazio Sandra
Purchase Details
Closed on
Jan 24, 2003
Sold by
Beazer Homes Holdings Corp
Bought by
Fazio Michael A
Home Financials for this Owner
Home Financials are based on the most recent Mortgage that was taken out on this home.
Original Mortgage
$139,200
Interest Rate
5.97%
Create a Home Valuation Report for This Property
The Home Valuation Report is an in-depth analysis detailing your home's value as well as a comparison with similar homes in the area
Home Values in the Area
Average Home Value in this Area
Purchase History
| Date | Buyer | Sale Price | Title Company |
|---|---|---|---|
| Wilkes Thomas | $103,000 | Nevada Title Las Vegas | |
| Fazio Michael A | -- | None Available | |
| Fazio Michael | -- | None Available | |
| Fazio Michael A | $174,968 | Lawyers Title Of Nevada |
Source: Public Records
Mortgage History
| Date | Status | Borrower | Loan Amount |
|---|---|---|---|
| Open | Wilkes Thomas | $93,627 | |
| Previous Owner | Fazio Michael A | $139,200 | |
| Closed | Fazio Michael A | $34,800 |
Source: Public Records
Tax History
| Year | Tax Paid | Tax Assessment Tax Assessment Total Assessment is a certain percentage of the fair market value that is determined by local assessors to be the total taxable value of land and additions on the property. | Land | Improvement |
|---|---|---|---|---|
| 2026 | $1,486 | $94,789 | $36,050 | $58,739 |
| 2025 | $1,442 | $93,064 | $34,300 | $58,764 |
| 2024 | $1,400 | $93,064 | $34,300 | $58,764 |
| 2023 | $1,400 | $82,482 | $29,050 | $53,432 |
| 2022 | $1,360 | $76,576 | $25,900 | $50,676 |
| 2021 | $1,320 | $64,036 | $22,400 | $41,636 |
| 2020 | $1,279 | $63,564 | $20,300 | $43,264 |
| 2019 | $1,205 | $61,126 | $17,850 | $43,276 |
| 2018 | $1,170 | $56,102 | $14,700 | $41,402 |
| 2017 | $1,583 | $54,150 | $13,300 | $40,850 |
| 2016 | $1,109 | $52,121 | $11,550 | $40,571 |
| 2015 | $1,099 | $43,477 | $7,700 | $35,777 |
| 2014 | $1,064 | $38,436 | $7,000 | $31,436 |
Source: Public Records
Map
Nearby Homes
- 739 Solitude Point Ave
- 761 Solitude Point Ave
- 207 Priority Point St
- 228 Priority Point St
- 677 Principle Point Ave
- 192 Mount Saint Helens Dr
- 216 Glen Lee St
- 176 Kirkton St
- 229 Glen Lee St
- 824 Plockton Ave
- 840 Tarbet Ave
- 795 Camino la Paz
- 145 Strone St
- 276 Crimson Edge St
- 118 Crescent Bay St
- 755 Camino Del Ray
- 475 Baby Eagle St
- 114 Gamboge St Unit 2C
- 933 Everest Peak Ave
- 317 Crimson Edge St
- 716 Solitude Point Ave
- 720 Solitude Point Ave
- 712 Solitude Point Ave
- 726 Solitude Point Ave
- 211 Positive Point St
- 710 Solitude Point Ave
- 210 Positive Point St
- 728 Solitude Point Ave Unit 1
- 708 Solitude Point Ave
- 213 Positive Point St
- 213 Positive Point St Unit none
- 210 Abundance Ridge St Unit 2
- 212 Positive Point St
- 212 Abundance Ridge St
- 706 Solitude Point Ave
- 730 Solitude Point Ave
- 215 Positive Point St
- 214 Positive Point St
- 214 Abundance Ridge St Unit 2
- 732 Solitude Point Ave Unit 1
Your Personal Tour Guide
Ask me questions while you tour the home.