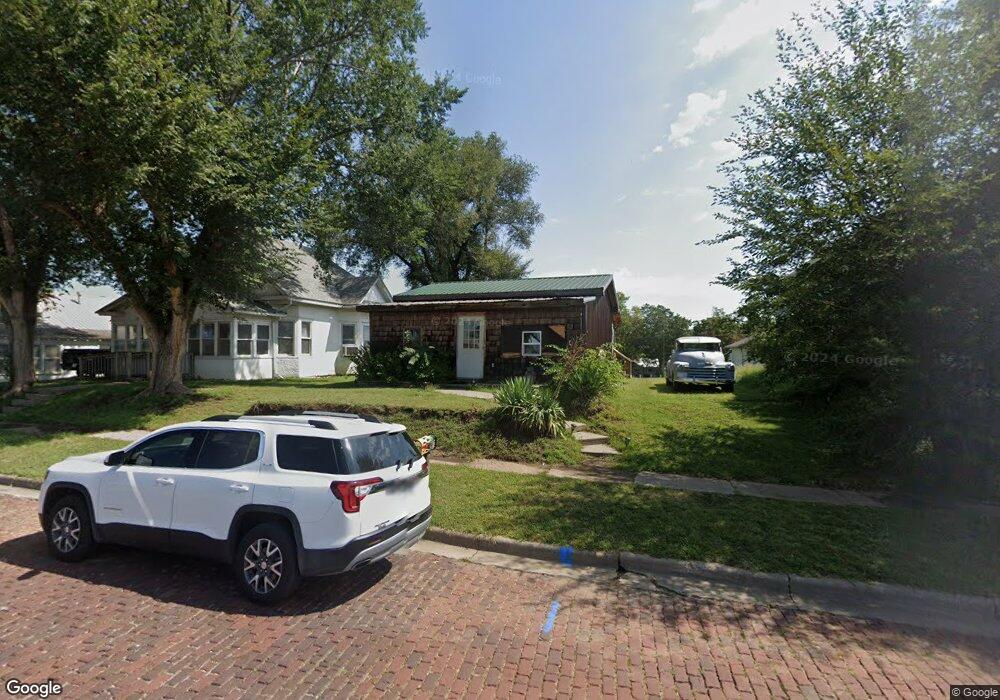
718 Stone St Falls City, NE 68355
Estimated Value: $46,000 - $56,720
1
Bed
1
Bath
576
Sq Ft
$89/Sq Ft
Est. Value
About This Home
This home is located at 718 Stone St, Falls City, NE 68355 and is currently estimated at $51,180, approximately $88 per square foot. 718 Stone St is a home located in Richardson County with nearby schools including Falls City North Elementary School, Falls City South Elementary School, and Falls City Middle School.
Ownership History
Date
Name
Owned For
Owner Type
Purchase Details
Closed on
Feb 1, 2013
Sold by
Baker Jameson J and Baker Magumi
Bought by
Curtis Jack and Curtis Fern
Current Estimated Value
Home Financials for this Owner
Home Financials are based on the most recent Mortgage that was taken out on this home.
Original Mortgage
$16,211
Outstanding Balance
$11,317
Interest Rate
3.38%
Mortgage Type
New Conventional
Estimated Equity
$39,863
Purchase Details
Closed on
Dec 31, 2012
Sold by
Witt Robert J and Witt Tamela K
Bought by
Baker Jameson J and Baker Magumi
Home Financials for this Owner
Home Financials are based on the most recent Mortgage that was taken out on this home.
Original Mortgage
$16,211
Outstanding Balance
$11,317
Interest Rate
3.38%
Mortgage Type
New Conventional
Estimated Equity
$39,863
Purchase Details
Closed on
Apr 12, 2003
Sold by
Curtis Jack and Curtis Fern
Bought by
Witt Robert
Purchase Details
Closed on
Jul 28, 2000
Sold by
Tackett Richard and Tackett Mary H
Bought by
Curtis Jack and Curtis Fern
Create a Home Valuation Report for This Property
The Home Valuation Report is an in-depth analysis detailing your home's value as well as a comparison with similar homes in the area
Home Values in the Area
Average Home Value in this Area
Purchase History
| Date | Buyer | Sale Price | Title Company |
|---|---|---|---|
| Curtis Jack | -- | -- | |
| Baker Jameson J | -- | -- | |
| Witt Robert | $7,650 | -- | |
| Curtis Jack | $8,000 | -- |
Source: Public Records
Mortgage History
| Date | Status | Borrower | Loan Amount |
|---|---|---|---|
| Open | Curtis Jack | $16,211 |
Source: Public Records
Tax History Compared to Growth
Tax History
| Year | Tax Paid | Tax Assessment Tax Assessment Total Assessment is a certain percentage of the fair market value that is determined by local assessors to be the total taxable value of land and additions on the property. | Land | Improvement |
|---|---|---|---|---|
| 2025 | $175 | $20,333 | $3,000 | $17,333 |
| 2024 | $175 | $15,545 | $3,000 | $12,545 |
| 2023 | $332 | $20,214 | $3,000 | $17,214 |
| 2022 | $140 | $7,295 | $1,620 | $5,675 |
| 2021 | $0 | $11,834 | $1,620 | $10,214 |
| 2020 | $0 | $11,348 | $1,620 | $9,728 |
| 2019 | $0 | $11,065 | $1,620 | $9,445 |
| 2018 | $210 | $10,790 | $1,620 | $9,170 |
| 2017 | $210 | $10,790 | $1,620 | $9,170 |
| 2016 | $204 | $10,523 | $1,620 | $8,903 |
| 2015 | $205 | $10,523 | $1,620 | $8,903 |
| 2014 | $204 | $10,523 | $1,620 | $8,903 |
Source: Public Records
Map
Nearby Homes