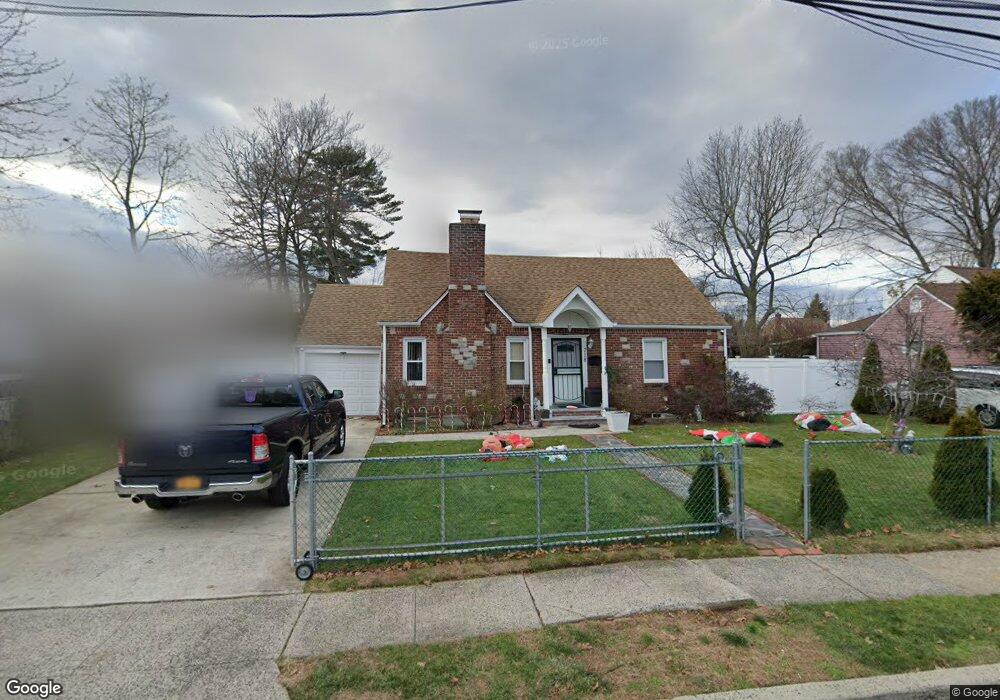
718 Tower Ct Uniondale, NY 11553
Estimated Value: $688,000 - $750,850
Studio
2
Baths
1,350
Sq Ft
$533/Sq Ft
Est. Value
About This Home
This home is located at 718 Tower Ct, Uniondale, NY 11553 and is currently estimated at $719,425, approximately $532 per square foot. 718 Tower Ct is a home located in Nassau County with nearby schools including Smith Street Elementary School, Turtle Hook Middle School, and Uniondale High School.
Ownership History
Date
Name
Owned For
Owner Type
Purchase Details
Closed on
Nov 5, 2010
Sold by
Nassau County Redevelopment Project Ll
Bought by
Ramirez Maria A
Current Estimated Value
Home Financials for this Owner
Home Financials are based on the most recent Mortgage that was taken out on this home.
Original Mortgage
$345,300
Outstanding Balance
$241,658
Interest Rate
5.5%
Mortgage Type
FHA
Estimated Equity
$477,767
Purchase Details
Closed on
Jul 12, 2010
Sold by
King Shoba C and Of Suzanne King
Bought by
Nassau County Redevelopment Project Ll
Create a Home Valuation Report for This Property
The Home Valuation Report is an in-depth analysis detailing your home's value as well as a comparison with similar homes in the area
Home Values in the Area
Average Home Value in this Area
Purchase History
| Date | Buyer | Sale Price | Title Company |
|---|---|---|---|
| Ramirez Maria A | $350,000 | -- | |
| Nassau County Redevelopment Project Ll | $160,000 | -- |
Source: Public Records
Mortgage History
| Date | Status | Borrower | Loan Amount |
|---|---|---|---|
| Open | Ramirez Maria A | $345,300 |
Source: Public Records
Tax History
| Year | Tax Paid | Tax Assessment Tax Assessment Total Assessment is a certain percentage of the fair market value that is determined by local assessors to be the total taxable value of land and additions on the property. | Land | Improvement |
|---|---|---|---|---|
| 2025 | $10,635 | $470 | $188 | $282 |
| 2024 | $3,624 | $470 | $188 | $282 |
Source: Public Records
Map
Nearby Homes
- 726 Northern Pkwy
- 650 Northern Pkwy
- 747 New St
- 731 Planders Ave
- 820 Southern Pkwy
- 588 Newton Ave
- 701 Nostrand Ave
- 546 Clark Place
- 692 Beck St
- 522 Southern Pkwy
- 172 Argyle Ave
- 727 Beck St
- 123 Smith St
- 602 Leonard Ave
- 551 Emerson St
- 721 Martin Dr
- 1027 Jerusalem Ave Unit 123
- 695 Goodrich St
- 472 Emerson St
- 119 E Pennywood Ave
Your Personal Tour Guide
Ask me questions while you tour the home.