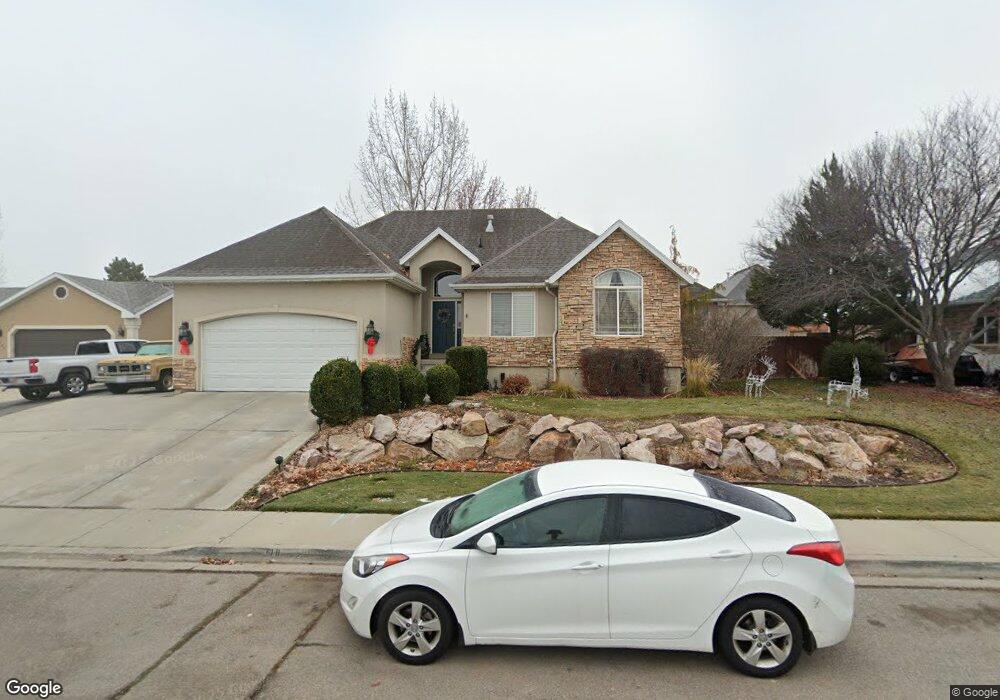
718 W 1310 N Pleasant Grove, UT 84062
Estimated Value: $623,748 - $765,000
6
Beds
3
Baths
2,944
Sq Ft
$234/Sq Ft
Est. Value
About This Home
This home is located at 718 W 1310 N, Pleasant Grove, UT 84062 and is currently estimated at $687,437, approximately $233 per square foot. 718 W 1310 N is a home located in Utah County with nearby schools including Mount Mahogany School, Pleasant Grove Junior High School, and Pleasant Grove High School.
Ownership History
Date
Name
Owned For
Owner Type
Purchase Details
Closed on
Sep 17, 2018
Sold by
Hatfield Matthew and Hatfield Diane
Bought by
Hatfield Matthew and Hatfield Elizabeth Marie
Current Estimated Value
Home Financials for this Owner
Home Financials are based on the most recent Mortgage that was taken out on this home.
Original Mortgage
$389,500
Outstanding Balance
$339,698
Interest Rate
4.6%
Mortgage Type
New Conventional
Estimated Equity
$347,739
Purchase Details
Closed on
Apr 15, 1999
Sold by
Biegel Thorpe D
Bought by
Harrison Randall J and Harrison Leslie L
Home Financials for this Owner
Home Financials are based on the most recent Mortgage that was taken out on this home.
Original Mortgage
$140,000
Interest Rate
7.04%
Create a Home Valuation Report for This Property
The Home Valuation Report is an in-depth analysis detailing your home's value as well as a comparison with similar homes in the area
Home Values in the Area
Average Home Value in this Area
Purchase History
| Date | Buyer | Sale Price | Title Company |
|---|---|---|---|
| Hatfield Matthew | -- | Accommodation | |
| Hatfield Matthew | -- | First Title Ins Agency | |
| Harrison Randall J | -- | Equity Title Agency Inc |
Source: Public Records
Mortgage History
| Date | Status | Borrower | Loan Amount |
|---|---|---|---|
| Open | Hatfield Matthew | $389,500 | |
| Previous Owner | Harrison Randall J | $140,000 |
Source: Public Records
Tax History Compared to Growth
Tax History
| Year | Tax Paid | Tax Assessment Tax Assessment Total Assessment is a certain percentage of the fair market value that is determined by local assessors to be the total taxable value of land and additions on the property. | Land | Improvement |
|---|---|---|---|---|
| 2025 | $2,658 | $327,415 | $280,800 | $314,500 |
| 2024 | $2,658 | $317,185 | $0 | $0 |
| 2023 | $2,575 | $314,600 | $0 | $0 |
| 2022 | $2,815 | $342,265 | $0 | $0 |
| 2021 | $2,326 | $430,600 | $164,900 | $265,700 |
| 2020 | $2,210 | $401,000 | $152,700 | $248,300 |
| 2019 | $2,011 | $377,300 | $142,300 | $235,000 |
| 2018 | $1,809 | $320,900 | $138,800 | $182,100 |
| 2017 | $1,722 | $162,635 | $0 | $0 |
| 2016 | $1,661 | $151,470 | $0 | $0 |
| 2015 | $1,707 | $147,400 | $0 | $0 |
| 2014 | $1,612 | $137,885 | $0 | $0 |
Source: Public Records
Map
Nearby Homes
- 1051 N 600 W
- 1031 N 600 W
- 1041 N 600 W
- 1534 N 750 W Unit 16
- Konlee Plan at Makin Dreams
- Alexa Plan at Makin Dreams
- Callahan Plan at Makin Dreams
- Hailey Plan at Makin Dreams
- Alydia Plan at Makin Dreams
- Addison Plan at Makin Dreams
- Julia Plan at Makin Dreams
- 1531 N 750 W Unit 4
- Aaron Plan at Makin Dreams
- Amie Plan at Makin Dreams
- Nora Plan at Makin Dreams
- Emmet Plan at Makin Dreams
- Quinn Plan at Makin Dreams
- Chelsea Plan at Makin Dreams
- Jenni Plan at Makin Dreams
- Dakota Plan at Makin Dreams