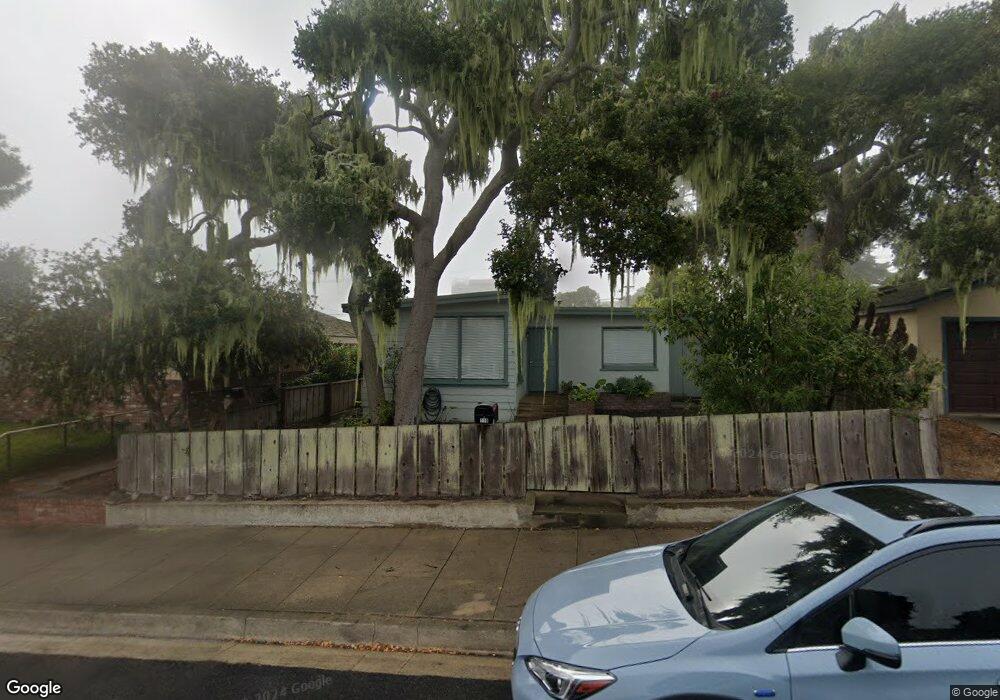
719 17th St Pacific Grove, CA 93950
Estimated Value: $956,133 - $1,213,000
1
Bed
1
Bath
1,031
Sq Ft
$1,050/Sq Ft
Est. Value
About This Home
This home is located at 719 17th St, Pacific Grove, CA 93950 and is currently estimated at $1,082,783, approximately $1,050 per square foot. 719 17th St is a home located in Monterey County with nearby schools including Robert Down Elementary School, Pacific Grove Middle School, and Pacific Grove High School.
Ownership History
Date
Name
Owned For
Owner Type
Purchase Details
Closed on
Jul 24, 2019
Sold by
Snyder Agnes and Don And Agnes Snyder Living Tr
Bought by
Snyder Agnes and Agnes Snyder Living Trust
Current Estimated Value
Purchase Details
Closed on
Jul 25, 2017
Sold by
Snyder Donald Arthur
Bought by
Snyder Don and Snyder Agnes
Purchase Details
Closed on
Mar 3, 2006
Sold by
Snyder Donald Arthur and Snyder Joseph Dean
Bought by
Snyder Donald Arthur
Purchase Details
Closed on
Jul 24, 1995
Sold by
Snyder Melvin D and Snyder Betty P
Bought by
Snyder Melvin Dean and Snyder Betty Pauline
Create a Home Valuation Report for This Property
The Home Valuation Report is an in-depth analysis detailing your home's value as well as a comparison with similar homes in the area
Home Values in the Area
Average Home Value in this Area
Purchase History
We collect this data history from publicly available records. To have your information removed, we recommend requesting removal directly through your county’s website.
| Date | Buyer | Sale Price | Title Company |
|---|---|---|---|
| Snyder Agnes | -- | None Available | |
| Snyder Don | -- | None Available | |
| Snyder Donald Arthur | -- | None Available | |
| Snyder Melvin Dean | -- | -- |
Source: Public Records
Tax History
| Year | Tax Paid | Tax Assessment Tax Assessment Total Assessment is a certain percentage of the fair market value that is determined by local assessors to be the total taxable value of land and additions on the property. | Land | Improvement |
|---|---|---|---|---|
| 2025 | $700 | $63,268 | $22,007 | $41,261 |
| 2024 | $700 | $62,028 | $21,576 | $40,452 |
| 2023 | $744 | $60,812 | $21,153 | $39,659 |
| 2022 | $730 | $59,621 | $20,739 | $38,882 |
| 2021 | $726 | $58,453 | $20,333 | $38,120 |
| 2020 | $712 | $57,855 | $20,125 | $37,730 |
| 2019 | $691 | $56,722 | $19,731 | $36,991 |
| 2018 | $680 | $55,611 | $19,345 | $36,266 |
| 2017 | $670 | $54,521 | $18,966 | $35,555 |
| 2016 | $670 | $53,453 | $18,595 | $34,858 |
| 2015 | $660 | $52,651 | $18,316 | $34,335 |
| 2014 | $647 | $51,621 | $17,958 | $33,663 |
Source: Public Records
Map
Nearby Homes
Your Personal Tour Guide
Ask me questions while you tour the home.