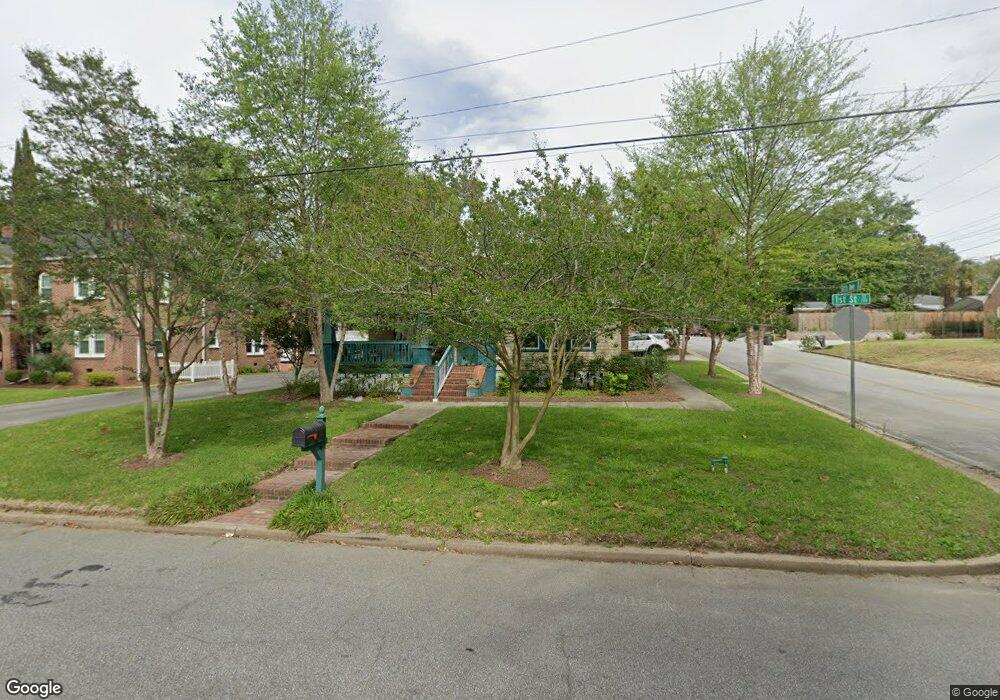
719 1st St SE Moultrie, GA 31768
Estimated Value: $138,821 - $180,000
--
Bed
1
Bath
1,357
Sq Ft
$115/Sq Ft
Est. Value
About This Home
This home is located at 719 1st St SE, Moultrie, GA 31768 and is currently estimated at $155,455, approximately $114 per square foot. 719 1st St SE is a home located in Colquitt County with nearby schools including Stringfellow Elementary School, Willie J. Williams Middle School, and C.A. Gray Junior High School.
Ownership History
Date
Name
Owned For
Owner Type
Purchase Details
Closed on
Dec 21, 2016
Bought by
Frazier Marchell
Current Estimated Value
Home Financials for this Owner
Home Financials are based on the most recent Mortgage that was taken out on this home.
Original Mortgage
$52,687
Interest Rate
4.03%
Mortgage Type
New Conventional
Purchase Details
Closed on
Sep 16, 2016
Sold by
Ameris Bk
Bought by
Benmar Llc
Purchase Details
Closed on
Aug 2, 2016
Sold by
Lyle N
Bought by
Ameris Bank
Purchase Details
Closed on
Jun 24, 2005
Sold by
Bvg Properties Llc
Bought by
West Lyle and West Gina
Home Financials for this Owner
Home Financials are based on the most recent Mortgage that was taken out on this home.
Original Mortgage
$100,279
Interest Rate
5.57%
Mortgage Type
New Conventional
Purchase Details
Closed on
Jun 17, 1999
Bought by
Bvg Properties Llc
Purchase Details
Closed on
Mar 22, 1999
Bought by
Register Ruby
Create a Home Valuation Report for This Property
The Home Valuation Report is an in-depth analysis detailing your home's value as well as a comparison with similar homes in the area
Home Values in the Area
Average Home Value in this Area
Purchase History
| Date | Buyer | Sale Price | Title Company |
|---|---|---|---|
| Frazier Marchell | $52,000 | -- | |
| Benmar Llc | $60,000 | -- | |
| Ameris Bank | $63,000 | -- | |
| West Lyle | $84,000 | -- | |
| Bvg Properties Llc | $60,000 | -- | |
| Register Ruby | -- | -- |
Source: Public Records
Mortgage History
| Date | Status | Borrower | Loan Amount |
|---|---|---|---|
| Closed | Frazier Marchell | $52,687 | |
| Previous Owner | West Lyle | $100,279 |
Source: Public Records
Tax History Compared to Growth
Tax History
| Year | Tax Paid | Tax Assessment Tax Assessment Total Assessment is a certain percentage of the fair market value that is determined by local assessors to be the total taxable value of land and additions on the property. | Land | Improvement |
|---|---|---|---|---|
| 2024 | $1,867 | $53,812 | $1,876 | $51,936 |
| 2023 | $1,624 | $29,167 | $1,876 | $27,291 |
| 2022 | $932 | $27,829 | $1,876 | $25,953 |
| 2021 | $892 | $26,298 | $1,876 | $24,422 |
| 2020 | $851 | $24,672 | $1,876 | $22,796 |
| 2019 | $895 | $23,045 | $1,876 | $21,169 |
| 2018 | $920 | $23,045 | $1,876 | $21,169 |
| 2017 | $885 | $23,045 | $1,876 | $21,169 |
| 2015 | $1,240 | $30,962 | $2,280 | $28,682 |
| 2014 | $1,270 | $30,962 | $2,280 | $28,682 |
| 2013 | -- | $30,961 | $2,280 | $28,681 |
Source: Public Records
Map
Nearby Homes
- 902 2nd St SE
- 600 1st St SE
- 209 7th Ave SW
- 515 5th Ave SE Unit 4
- 521 5th Ave SE Unit 4
- 704 3rd St SW
- 717 5th Ave SE
- 407 1st Ave SE
- 310 1st Ave SW
- 221 6th St SW
- 610 4th Ave SW
- 1175 4th St SW
- 118 5th St SW
- 1160 4th St SW
- 619 E Central Ave
- 515 8th St SW
- 00 1st Ave SW
- 1021 11th Ave SE
- 1159 6th St SW
- 210 13th Ave SE