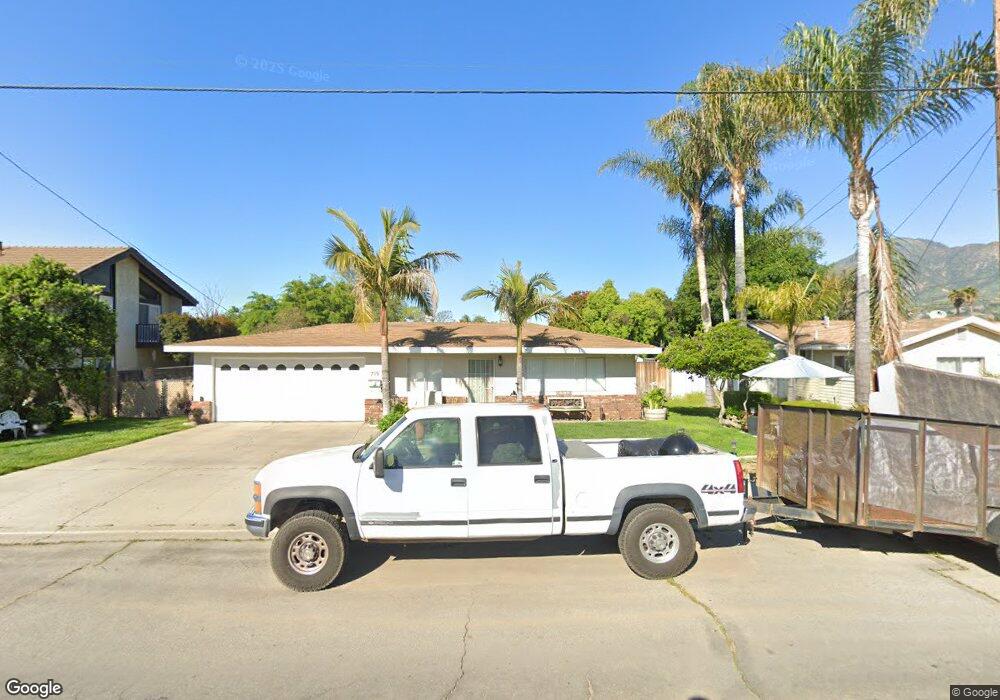
719 A St Fillmore, CA 93015
Estimated Value: $471,000 - $658,000
About This Home
This home is located at 719 A St, Fillmore, CA 93015 and is currently estimated at $588,242, approximately $529 per square foot. 719 A St is a home located in Ventura County with nearby schools including Mountain Vista and Fillmore Senior High.
Ownership History
We collect this data history from publicly available records. To have your information removed, we recommend requesting removal directly through your county’s website.
Purchase Details
Purchase Details
Home Financials for this Owner
Home Financials are based on the most recent Mortgage that was taken out on this home.Home Values in the Area
Average Home Value in this Area
Purchase History
We collect this data history from publicly available records. To have your information removed, we recommend requesting removal directly through your county’s website.
| Date | Buyer | Sale Price | Title Company |
|---|---|---|---|
| -- | None Available | ||
| $175,000 | Fidelity National Title Co |
Mortgage History
We collect this data history from publicly available records. To have your information removed, we recommend requesting removal directly through your county’s website.
| Date | Status | Borrower | Loan Amount |
|---|---|---|---|
| Previous Owner | $171,830 |
Tax History
We collect this data history from publicly available records. To have your information removed, we recommend requesting removal directly through your county’s website.
| Year | Tax Paid | Tax Assessment Tax Assessment Total Assessment is a certain percentage of the fair market value that is determined by local assessors to be the total taxable value of land and additions on the property. | Land | Improvement |
|---|---|---|---|---|
| 2025 | $2,344 | $215,487 | $129,294 | $86,193 |
| 2024 | $2,344 | $211,262 | $126,759 | $84,503 |
| 2023 | $2,312 | $207,120 | $124,273 | $82,847 |
| 2022 | $2,137 | $203,059 | $121,836 | $81,223 |
| 2021 | $2,425 | $199,078 | $119,447 | $79,631 |
| 2020 | $2,250 | $197,038 | $118,223 | $78,815 |
| 2019 | $2,255 | $193,175 | $115,905 | $77,270 |
| 2018 | $2,209 | $189,388 | $113,633 | $75,755 |
| 2017 | $2,221 | $185,675 | $111,405 | $74,270 |
| 2016 | $2,056 | $182,035 | $109,221 | $72,814 |
| 2015 | $1,998 | $179,303 | $107,582 | $71,721 |
| 2014 | $1,996 | $175,793 | $105,476 | $70,317 |
Map
- 809 Woodgrove Rd
- 815 Woodgrove Rd
- 639 Clay St
- 379 Foothill Dr
- 333 3rd St
- 331 Blaine Ave
- 300 Fillmore St
- 404 Central Ave
- 639 Mountain View St
- 1106 Shadow Ridge Way
- 503 Arundell Cir
- 1022 Shadow Ridge Way
- 1168 Shadow Ridge Way
- 1160 Shadow Ridge Way
- 340 Central Ave
- 449 Clay St
- 1152 Shadow Ridge Way
- 328 Clay St
- 553 Grapefruit Ln
- 1143 Los Serenos Dr
Ask me questions while you tour the home.