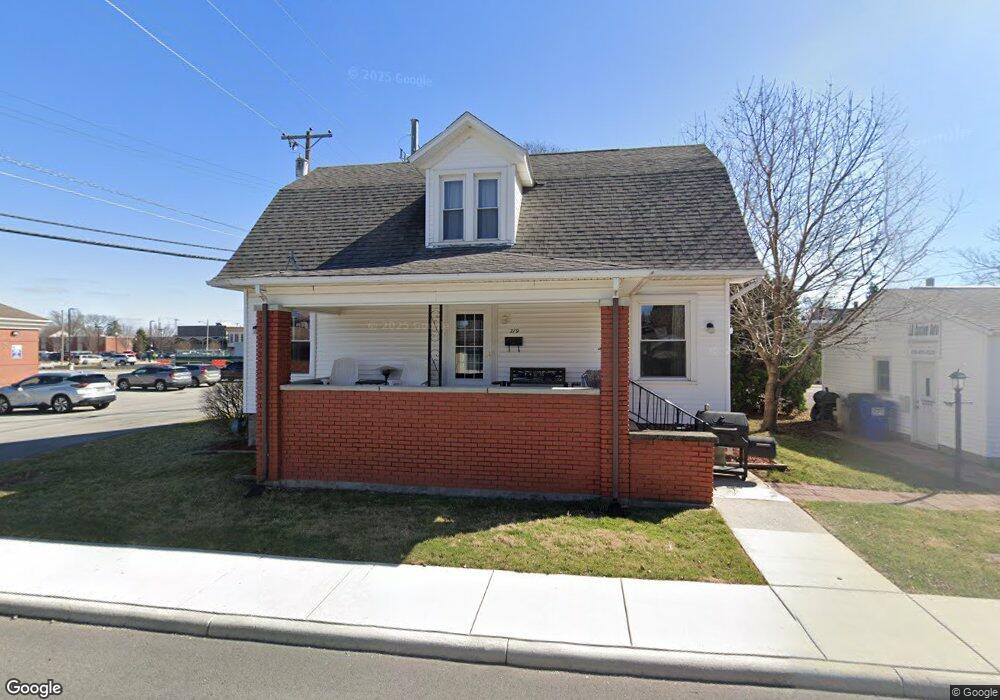
719 Beech Ave Findlay, OH 45840
Estimated Value: $161,000 - $182,000
3
Beds
1
Bath
1,417
Sq Ft
$123/Sq Ft
Est. Value
About This Home
This home is located at 719 Beech Ave, Findlay, OH 45840 and is currently estimated at $173,706, approximately $122 per square foot. 719 Beech Ave is a home located in Hancock County with nearby schools including Lincoln Elementary School, Donnell Middle School, and Findlay High School.
Ownership History
Date
Name
Owned For
Owner Type
Purchase Details
Closed on
May 13, 2010
Sold by
Albach Robert W and Albach Marilyn M
Bought by
Logsdon Jack S
Current Estimated Value
Home Financials for this Owner
Home Financials are based on the most recent Mortgage that was taken out on this home.
Original Mortgage
$70,000
Outstanding Balance
$47,125
Interest Rate
5.14%
Mortgage Type
New Conventional
Estimated Equity
$126,581
Purchase Details
Closed on
May 15, 2000
Sold by
Zeltner Kenneth C
Bought by
Bank One Trust Co
Create a Home Valuation Report for This Property
The Home Valuation Report is an in-depth analysis detailing your home's value as well as a comparison with similar homes in the area
Home Values in the Area
Average Home Value in this Area
Purchase History
| Date | Buyer | Sale Price | Title Company |
|---|---|---|---|
| Logsdon Jack S | $89,000 | Assured Title Agency | |
| Bank One Trust Co | $84,000 | -- |
Source: Public Records
Mortgage History
| Date | Status | Borrower | Loan Amount |
|---|---|---|---|
| Open | Logsdon Jack S | $70,000 |
Source: Public Records
Tax History Compared to Growth
Tax History
| Year | Tax Paid | Tax Assessment Tax Assessment Total Assessment is a certain percentage of the fair market value that is determined by local assessors to be the total taxable value of land and additions on the property. | Land | Improvement |
|---|---|---|---|---|
| 2024 | $1,648 | $46,390 | $4,320 | $42,070 |
| 2023 | $1,650 | $46,390 | $4,320 | $42,070 |
| 2022 | $1,645 | $46,390 | $4,320 | $42,070 |
| 2021 | $1,363 | $33,480 | $4,330 | $29,150 |
| 2020 | $1,363 | $33,480 | $4,330 | $29,150 |
| 2019 | $1,335 | $33,480 | $4,330 | $29,150 |
| 2018 | $1,273 | $29,240 | $3,770 | $25,470 |
| 2017 | $636 | $29,240 | $3,770 | $25,470 |
| 2016 | $1,261 | $29,240 | $3,770 | $25,470 |
| 2015 | $1,003 | $22,940 | $3,460 | $19,480 |
| 2014 | $1,003 | $22,940 | $3,460 | $19,480 |
| 2012 | $1,013 | $22,940 | $3,460 | $19,480 |
Source: Public Records
Map
Nearby Homes