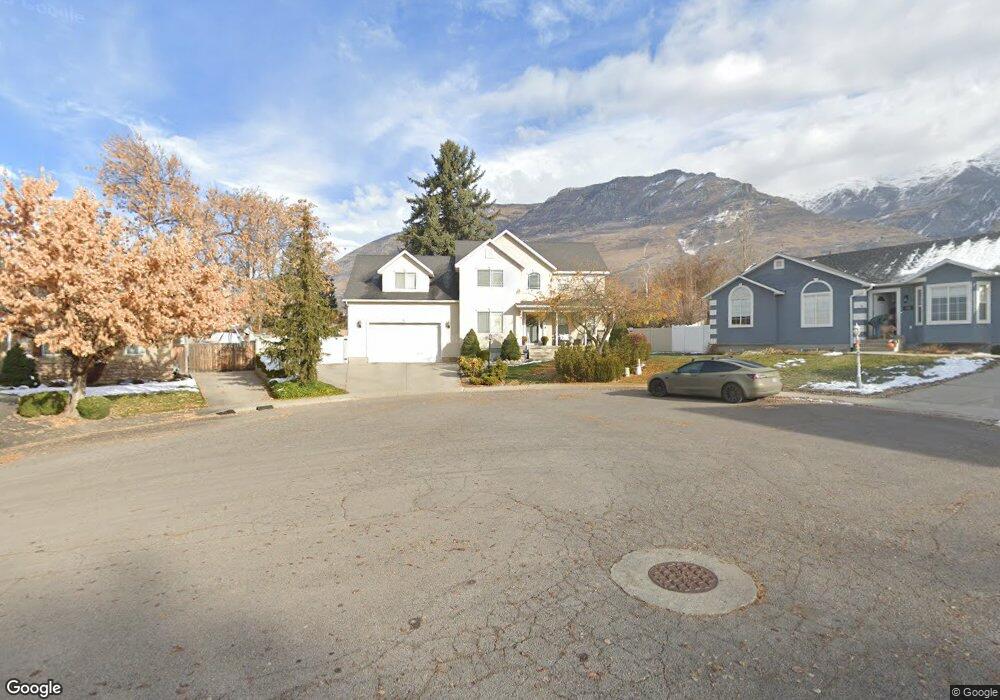
719 E 630 N Pleasant Grove, UT 84062
Estimated Value: $666,000 - $746,000
5
Beds
3
Baths
3,670
Sq Ft
$191/Sq Ft
Est. Value
About This Home
This home is located at 719 E 630 N, Pleasant Grove, UT 84062 and is currently estimated at $702,415, approximately $191 per square foot. 719 E 630 N is a home located in Utah County with nearby schools including Grovecrest Elementary School, Pleasant Grove Junior High School, and Pleasant Grove High School.
Ownership History
Date
Name
Owned For
Owner Type
Purchase Details
Closed on
Dec 18, 2018
Sold by
Moon David F and Moon Miranda
Bought by
Moon David F and Moon Miranda K
Current Estimated Value
Purchase Details
Closed on
Oct 15, 2008
Sold by
Chapman Darren W and Chapman Laura
Bought by
Moon David F and Moon Miranda
Home Financials for this Owner
Home Financials are based on the most recent Mortgage that was taken out on this home.
Original Mortgage
$190,000
Outstanding Balance
$122,274
Interest Rate
5.77%
Mortgage Type
Purchase Money Mortgage
Estimated Equity
$580,141
Purchase Details
Closed on
Apr 6, 2000
Sold by
Chapman Darren W and Chapman Laura
Bought by
Chapman Darren W
Home Financials for this Owner
Home Financials are based on the most recent Mortgage that was taken out on this home.
Original Mortgage
$160,000
Interest Rate
3.95%
Create a Home Valuation Report for This Property
The Home Valuation Report is an in-depth analysis detailing your home's value as well as a comparison with similar homes in the area
Home Values in the Area
Average Home Value in this Area
Purchase History
| Date | Buyer | Sale Price | Title Company |
|---|---|---|---|
| Moon David F | -- | None Available | |
| Moon David F | -- | First American Lindon | |
| Chapman Darren W | -- | Summit Title Co |
Source: Public Records
Mortgage History
| Date | Status | Borrower | Loan Amount |
|---|---|---|---|
| Open | Moon David F | $190,000 | |
| Previous Owner | Chapman Darren W | $160,000 |
Source: Public Records
Tax History Compared to Growth
Tax History
| Year | Tax Paid | Tax Assessment Tax Assessment Total Assessment is a certain percentage of the fair market value that is determined by local assessors to be the total taxable value of land and additions on the property. | Land | Improvement |
|---|---|---|---|---|
| 2025 | $2,732 | $335,995 | $226,000 | $384,900 |
| 2024 | $2,732 | $326,260 | $0 | $0 |
| 2023 | $2,748 | $335,775 | $0 | $0 |
| 2022 | $2,678 | $325,545 | $0 | $0 |
| 2021 | $2,441 | $451,800 | $162,100 | $289,700 |
| 2020 | $2,236 | $405,700 | $144,700 | $261,000 |
| 2019 | $2,116 | $397,100 | $137,500 | $259,600 |
| 2018 | $2,006 | $356,000 | $130,300 | $225,700 |
| 2017 | $1,971 | $186,230 | $0 | $0 |
| 2016 | $1,863 | $169,895 | $0 | $0 |
| 2015 | $1,876 | $162,030 | $0 | $0 |
| 2014 | $1,722 | $147,290 | $0 | $0 |
Source: Public Records
Map
Nearby Homes