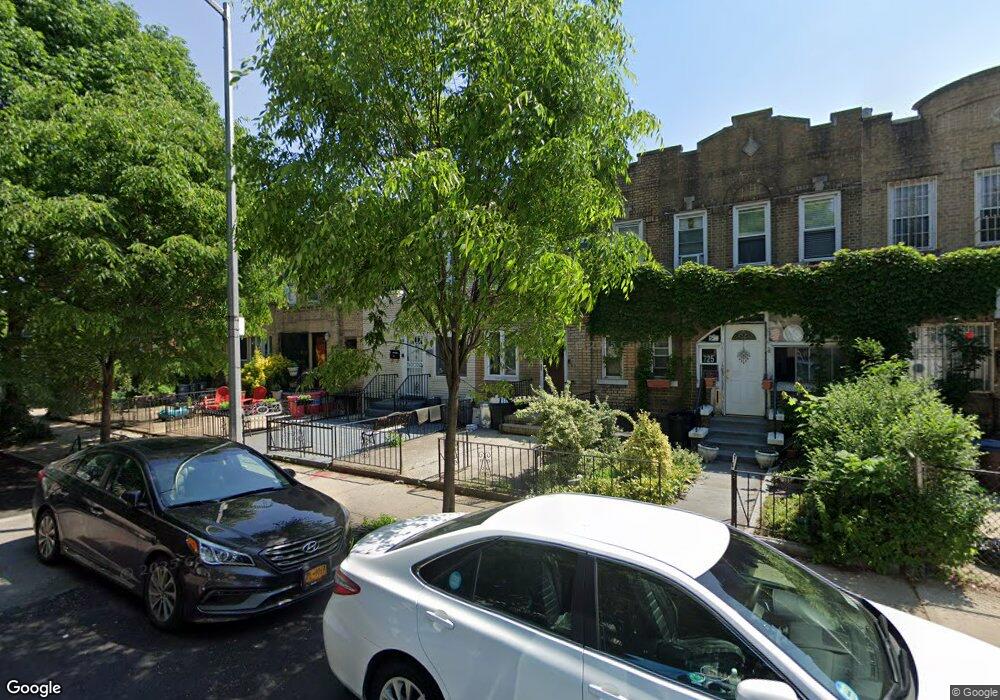
719 E 9th St Brooklyn, NY 11230
Midwood NeighborhoodEstimated Value: $973,000 - $1,461,000
Studio
--
Bath
1,464
Sq Ft
$796/Sq Ft
Est. Value
About This Home
This home is located at 719 E 9th St, Brooklyn, NY 11230 and is currently estimated at $1,165,975, approximately $796 per square foot. 719 E 9th St is a home located in Kings County with nearby schools including Ps 217 Colonel David Marcus School, Ditmas Junior High school, and Brooklyn Dreams Charter School.
Ownership History
Date
Name
Owned For
Owner Type
Purchase Details
Closed on
Aug 9, 2007
Sold by
Vallsworth Ralph J
Bought by
David Eric and Raible Rebecca
Current Estimated Value
Home Financials for this Owner
Home Financials are based on the most recent Mortgage that was taken out on this home.
Original Mortgage
$320,000
Outstanding Balance
$201,982
Interest Rate
6.78%
Mortgage Type
Purchase Money Mortgage
Estimated Equity
$963,993
Purchase Details
Closed on
Apr 30, 2004
Sold by
Rios and Vallsworth
Bought by
Vallsworth Ralph J
Purchase Details
Closed on
Apr 30, 1998
Sold by
Rios Ana Delia
Bought by
Rios Lizette M
Home Financials for this Owner
Home Financials are based on the most recent Mortgage that was taken out on this home.
Original Mortgage
$136,000
Interest Rate
10.88%
Create a Home Valuation Report for This Property
The Home Valuation Report is an in-depth analysis detailing your home's value as well as a comparison with similar homes in the area
Home Values in the Area
Average Home Value in this Area
Purchase History
| Date | Buyer | Sale Price | Title Company |
|---|---|---|---|
| David Eric | $499,000 | -- | |
| David Eric | $499,000 | -- | |
| Vallsworth Ralph J | -- | -- | |
| Vallsworth Ralph J | -- | -- | |
| Rios Lizette M | $170,000 | Safeco Title Insurance Compa | |
| Rios Lizette M | -- | Safeco Title Insurance Compa |
Source: Public Records
Mortgage History
| Date | Status | Borrower | Loan Amount |
|---|---|---|---|
| Open | David Eric | $320,000 | |
| Closed | David Eric | $320,000 | |
| Previous Owner | Rios Lizette M | $136,000 |
Source: Public Records
Tax History
| Year | Tax Paid | Tax Assessment Tax Assessment Total Assessment is a certain percentage of the fair market value that is determined by local assessors to be the total taxable value of land and additions on the property. | Land | Improvement |
|---|---|---|---|---|
| 2025 | $4,468 | $71,700 | $15,600 | $56,100 |
| 2024 | $4,468 | $69,360 | $15,600 | $53,760 |
| 2023 | $4,471 | $85,080 | $15,600 | $69,480 |
| 2022 | $3,093 | $87,960 | $15,600 | $72,360 |
| 2021 | $4,354 | $67,920 | $15,600 | $52,320 |
| 2020 | $2,037 | $74,340 | $15,600 | $58,740 |
| 2019 | $3,829 | $74,340 | $15,600 | $58,740 |
| 2018 | $3,680 | $19,514 | $5,335 | $14,179 |
| 2017 | $3,454 | $18,412 | $6,714 | $11,698 |
| 2016 | $3,371 | $18,412 | $7,684 | $10,728 |
| 2015 | $1,875 | $17,405 | $9,824 | $7,581 |
| 2014 | $1,875 | $16,420 | $9,472 | $6,948 |
Source: Public Records
Map
Nearby Homes
- 743 E 9th St
- 719 E 10th St
- 761 E 9th St
- 765 E 9th St
- 759 E 10th St Unit 7H
- 785 E 8th St
- 901 Avenue H Unit 4J
- 332 Parkville Ave
- 309 Parkville Ave
- 1113 Coney Island Ave
- 1117 Glenwood Rd
- 1135 Coney Island Ave
- 868 E 7th St Unit 3C
- 733 Ocean Pkwy Unit 8 A
- 249 Newkirk Ave
- 892 E 7th St Unit BF
- 623 Avenue H Unit 3 E
- 264 Webster Ave Unit 408
- 264 Webster Ave Unit 601
- 264 Webster Ave Unit 709
Your Personal Tour Guide
Ask me questions while you tour the home.