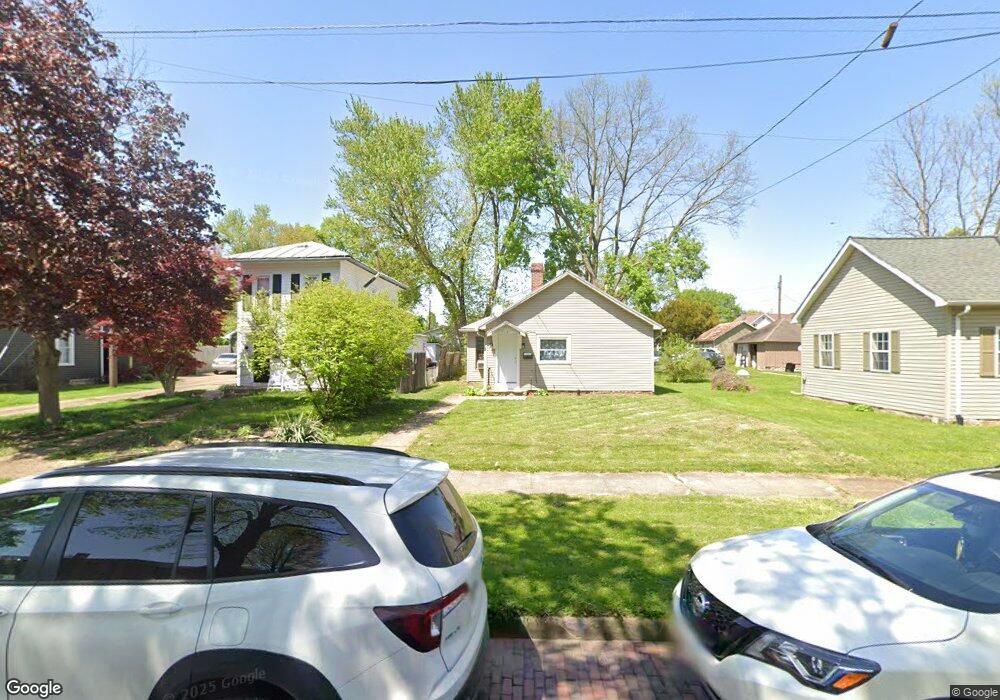
719 E Vine St Mount Vernon, OH 43050
Estimated Value: $126,002 - $187,000
2
Beds
1
Bath
764
Sq Ft
$205/Sq Ft
Est. Value
About This Home
This home is located at 719 E Vine St, Mount Vernon, OH 43050 and is currently estimated at $157,001, approximately $205 per square foot. 719 E Vine St is a home located in Knox County with nearby schools including Mount Vernon High School, St. Vincent de Paul School, and Christian Star Academy.
Ownership History
Date
Name
Owned For
Owner Type
Purchase Details
Closed on
Nov 27, 2013
Sold by
Strouse Roy E and Strouse Debra J
Bought by
Strouse International Ltd
Current Estimated Value
Home Financials for this Owner
Home Financials are based on the most recent Mortgage that was taken out on this home.
Original Mortgage
$202,500
Outstanding Balance
$151,891
Interest Rate
4.3%
Mortgage Type
Future Advance Clause Open End Mortgage
Estimated Equity
$5,110
Purchase Details
Closed on
Jul 24, 2002
Sold by
Stuller David M
Bought by
Strouse Roy E and Strouse Debra J
Purchase Details
Closed on
Jan 8, 1988
Sold by
Rose Kim M
Bought by
Stuller David M
Create a Home Valuation Report for This Property
The Home Valuation Report is an in-depth analysis detailing your home's value as well as a comparison with similar homes in the area
Home Values in the Area
Average Home Value in this Area
Purchase History
| Date | Buyer | Sale Price | Title Company |
|---|---|---|---|
| Strouse International Ltd | $86,250 | None Available | |
| Strouse Roy E | $58,000 | -- | |
| Stuller David M | $19,000 | -- |
Source: Public Records
Mortgage History
| Date | Status | Borrower | Loan Amount |
|---|---|---|---|
| Open | Strouse International Ltd | $202,500 |
Source: Public Records
Tax History
| Year | Tax Paid | Tax Assessment Tax Assessment Total Assessment is a certain percentage of the fair market value that is determined by local assessors to be the total taxable value of land and additions on the property. | Land | Improvement |
|---|---|---|---|---|
| 2024 | $933 | $24,080 | $4,750 | $19,330 |
| 2023 | $954 | $24,080 | $4,750 | $19,330 |
| 2022 | $840 | $19,260 | $3,800 | $15,460 |
| 2021 | $840 | $19,260 | $3,800 | $15,460 |
| 2020 | $818 | $19,260 | $3,800 | $15,460 |
| 2019 | $919 | $20,170 | $5,130 | $15,040 |
| 2018 | $920 | $20,170 | $5,130 | $15,040 |
| 2017 | $905 | $20,170 | $5,130 | $15,040 |
| 2016 | $841 | $18,680 | $4,750 | $13,930 |
| 2015 | $844 | $18,680 | $4,750 | $13,930 |
| 2014 | $848 | $18,680 | $4,750 | $13,930 |
| 2013 | $912 | $19,060 | $4,940 | $14,120 |
Source: Public Records
Map
Nearby Homes
- 501 Oak St
- 600 1/2 E Chestnut St
- 600 E Chestnut St Unit 1/2
- 203 S Center St
- 111 Potwin St
- 655 Howard St
- 649 Howard St
- 900 E Gambier St
- 213 Coshocton Ave
- 1107 Oak Street Extension
- 418 E Pleasant St
- 11 Highland Dr
- 6 Edgewood Blvd
- 208 E Burgess St
- 0 Miami St
- 12 3rd Ave
- 12 Third Ave
- 802 Coshocton Ave
- 14 Hilltop Dr
- 22 E Gamber St
Your Personal Tour Guide
Ask me questions while you tour the home.