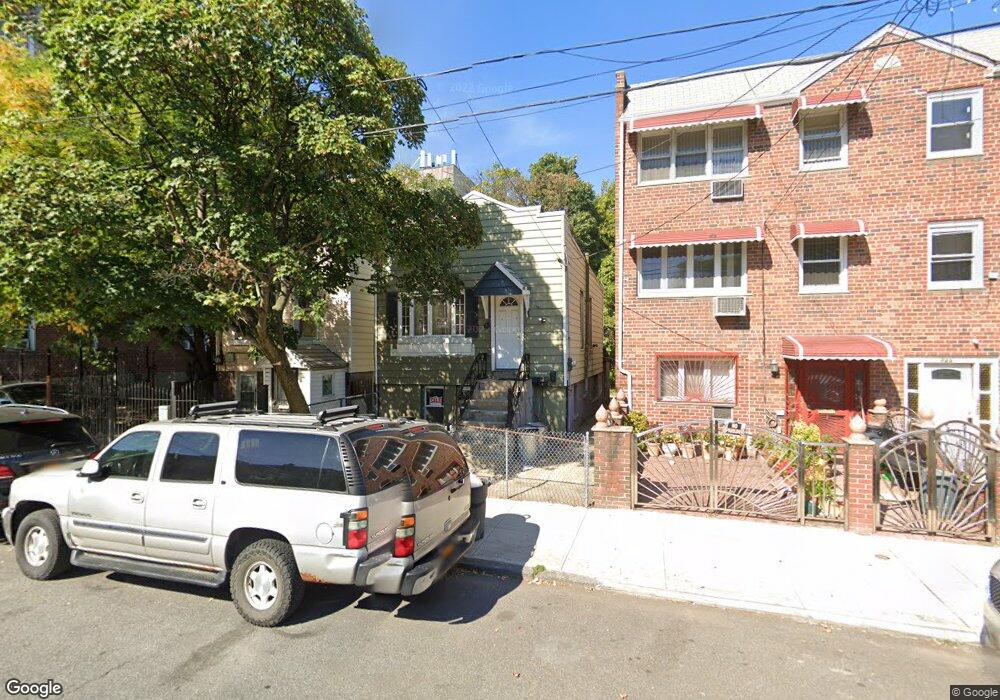
719 Fenimore St Brooklyn, NY 11203
East Flatbush NeighborhoodEstimated Value: $564,000 - $867,000
Studio
--
Bath
960
Sq Ft
$739/Sq Ft
Est. Value
About This Home
This home is located at 719 Fenimore St, Brooklyn, NY 11203 and is currently estimated at $709,265, approximately $738 per square foot. 719 Fenimore St is a home located in Kings County with nearby schools including P.S. 91 The Albany Avenue School, New Heights Middle School, and Achievement First Crown Heights Elementary School.
Ownership History
Date
Name
Owned For
Owner Type
Purchase Details
Closed on
Jun 27, 2002
Sold by
Sophia Griffiths
Bought by
Marcia Trellis
Current Estimated Value
Purchase Details
Closed on
Aug 7, 2001
Sold by
Dejoseph Frank and Dejoseph Robert
Bought by
Griffiths Sophia
Home Financials for this Owner
Home Financials are based on the most recent Mortgage that was taken out on this home.
Original Mortgage
$132,049
Interest Rate
6.98%
Mortgage Type
Purchase Money Mortgage
Purchase Details
Closed on
Jul 5, 2001
Sold by
Dejoseph Frank De and Dejoseph Robert De
Bought by
Joseph Frank Dejr and Dejoseph Robert
Home Financials for this Owner
Home Financials are based on the most recent Mortgage that was taken out on this home.
Original Mortgage
$132,049
Interest Rate
6.98%
Mortgage Type
Purchase Money Mortgage
Purchase Details
Closed on
Jun 10, 1996
Sold by
Dejoseph Frank and Dejoseph Robert
Bought by
Dejoseph Frank and Dejoseph Robert
Create a Home Valuation Report for This Property
The Home Valuation Report is an in-depth analysis detailing your home's value as well as a comparison with similar homes in the area
Home Values in the Area
Average Home Value in this Area
Purchase History
| Date | Buyer | Sale Price | Title Company |
|---|---|---|---|
| Marcia Trellis | -- | -- | |
| Marcia Trellis | -- | -- | |
| Griffiths Sophia | -- | -- | |
| Griffiths Sophia | -- | -- | |
| Joseph Frank Dejr | -- | -- | |
| Dejoseph Frank De | -- | -- | |
| Dejoseph Frank | -- | Commonwealth Land Title Ins | |
| Dejoseph Frank | -- | Commonwealth Land Title Ins |
Source: Public Records
Mortgage History
| Date | Status | Borrower | Loan Amount |
|---|---|---|---|
| Previous Owner | Griffiths Sophia | $132,049 |
Source: Public Records
Tax History
| Year | Tax Paid | Tax Assessment Tax Assessment Total Assessment is a certain percentage of the fair market value that is determined by local assessors to be the total taxable value of land and additions on the property. | Land | Improvement |
|---|---|---|---|---|
| 2025 | $3,332 | $46,500 | $14,880 | $31,620 |
| 2024 | $3,332 | $40,980 | $14,880 | $26,100 |
| 2023 | $3,179 | $49,380 | $14,880 | $34,500 |
| 2022 | $2,954 | $39,360 | $14,880 | $24,480 |
| 2021 | $2,940 | $40,260 | $14,880 | $25,380 |
| 2019 | $2,892 | $35,040 | $14,880 | $20,160 |
| 2018 | $2,659 | $13,046 | $6,563 | $6,483 |
| 2017 | $2,513 | $12,330 | $7,013 | $5,317 |
| 2016 | $2,328 | $11,643 | $7,219 | $4,424 |
| 2015 | $1,403 | $11,643 | $6,789 | $4,854 |
| 2014 | $1,403 | $11,520 | $7,793 | $3,727 |
Source: Public Records
Map
Nearby Homes
- 647 Midwood St Unit 3A
- 112 E 45th St
- 655 Maple St
- 584 Maple St
- 624 E New York Ave Unit 2B
- 10 E 43rd St Unit 4K
- 10 E 43rd St Unit 5e
- 10 E 43rd St Unit 4J
- 755 Albany Ave
- 770 Lefferts Ave Unit 3R
- 40 E 43rd St Unit 4H
- 40 E 43rd St Unit 2K
- 625 Lenox Rd
- 422 Troy Ave Unit 3UNITS
- 487 Midwood St
- 750 Troy Ave
- 401 Troy Ave
- 537 Brooklyn Ave Unit 4C
- 537 Brooklyn Ave Unit 6A
- 537 Brooklyn Ave Unit 5B
- 721 Fenimore St
- 717 Fenimore St
- 723 Fenimore St
- 725 Fenimore St
- 725 Fenimore St Unit 3
- 725 Fenimore St Unit 2
- 727 Fenimore St
- 731 Fenimore St
- 664-668 Rutland Rd
- 674 Rutland Rd
- 668 Rutland Rd Unit 3B
- 668 Rutland Rd
- 668 Rutland Rd Unit 1
- 668 Rutland Rd
- 664 Rutland Rd Unit 2B
- 664 Rutland Rd Unit 1-B
- 735 Fenimore St
- 737 Fenimore St
- 678 Rutland Rd
- 680 Rutland Rd
Your Personal Tour Guide
Ask me questions while you tour the home.