719 Franklin St Lima, OH 45804
Fifth Ward NeighborhoodEstimated Value: $84,000 - $148,000
3
Beds
1
Bath
1,508
Sq Ft
$80/Sq Ft
Est. Value
About This Home
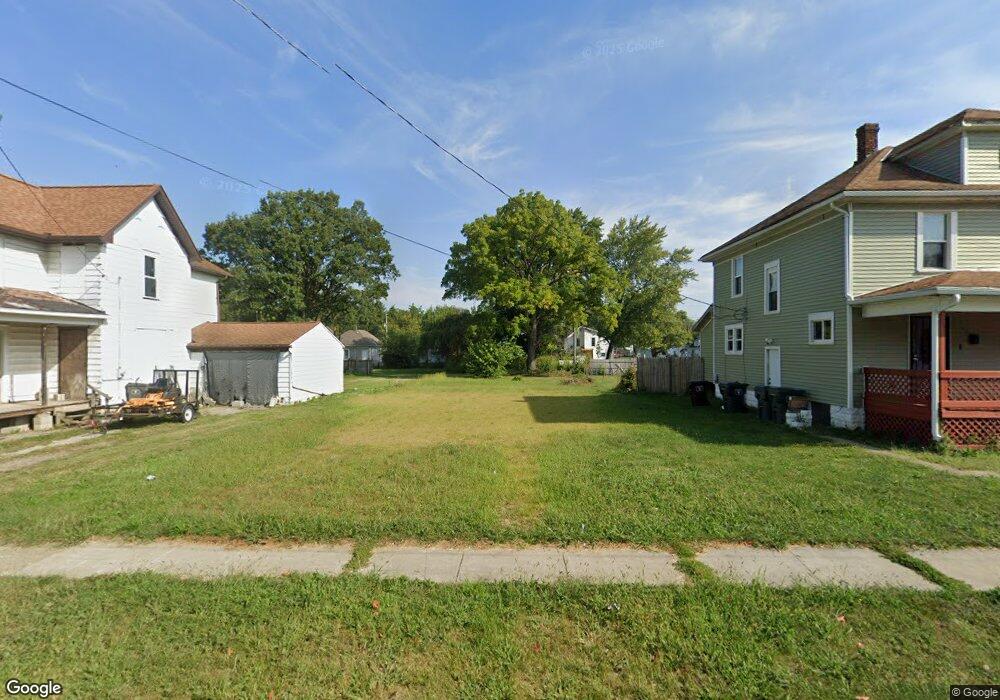
This home is located at 719 Franklin St, Lima, OH 45804 and is currently estimated at $120,000, approximately $79 per square foot. 719 Franklin St is a home located in Allen County with nearby schools including Freedom Elementary School, Lima North Middle School, and Lima West Middle School.
Ownership History
Date
Name
Owned For
Owner Type
Purchase Details
Closed on
Mar 6, 2018
Sold by
Johnson Zimion Damond
Bought by
Walton Tylea L
Current Estimated Value
Purchase Details
Closed on
Jun 11, 2014
Sold by
Johnson Gregory D
Bought by
Johnson Zimion Damond
Purchase Details
Closed on
Aug 3, 2009
Sold by
Huster Daniel and Huster Bonnie
Bought by
Johnson Gregory D
Purchase Details
Closed on
Sep 20, 2000
Sold by
Huster Dorothy
Bought by
Huster Bonnie and Huster Daniel
Home Financials for this Owner
Home Financials are based on the most recent Mortgage that was taken out on this home.
Original Mortgage
$20,500
Interest Rate
8.05%
Mortgage Type
New Conventional
Purchase Details
Closed on
Sep 16, 1987
Bought by
Huster Raymond
Create a Home Valuation Report for This Property
The Home Valuation Report is an in-depth analysis detailing your home's value as well as a comparison with similar homes in the area
Home Values in the Area
Average Home Value in this Area
Purchase History
| Date | Buyer | Sale Price | Title Company |
|---|---|---|---|
| Walton Tylea L | $900 | None Available | |
| Johnson Zimion Damond | $1,000 | None Available | |
| Johnson Gregory D | $300 | None Available | |
| Huster Bonnie | $18,000 | -- | |
| Huster Raymond | -- | -- |
Source: Public Records
Mortgage History
| Date | Status | Borrower | Loan Amount |
|---|---|---|---|
| Previous Owner | Huster Bonnie | $20,500 |
Source: Public Records
Tax History
| Year | Tax Paid | Tax Assessment Tax Assessment Total Assessment is a certain percentage of the fair market value that is determined by local assessors to be the total taxable value of land and additions on the property. | Land | Improvement |
|---|---|---|---|---|
| 2024 | $612 | $950 | $950 | -- |
| 2023 | $1,182 | $4,310 | $1,120 | $3,190 |
| 2022 | $1,385 | $4,310 | $1,120 | $3,190 |
| 2021 | $3,283 | $4,310 | $1,120 | $3,190 |
| 2020 | $460 | $6,060 | $1,120 | $4,940 |
| 2019 | $460 | $6,060 | $1,120 | $4,940 |
| 2018 | $355 | $6,060 | $1,120 | $4,940 |
| 2017 | $469 | $6,060 | $1,120 | $4,940 |
| 2016 | $530 | $6,060 | $1,120 | $4,940 |
| 2015 | $593 | $6,060 | $1,120 | $4,940 |
| 2014 | $593 | $6,580 | $1,190 | $5,390 |
| 2013 | $878 | $6,580 | $1,190 | $5,390 |
Source: Public Records
Map
Nearby Homes
- 706 E Kibby St
- 717 E Kibby St
- 546 Orena Ave
- 653 S Scott St
- 621 Prospect Ave
- 629 Harrison Ave
- 801 E Vine St
- 725 E Vine St
- 520 Orena Ave
- 812 E Vine St
- 818 Madison Ave
- 915 Michael Ave
- 544 S Pine St
- 0 E Vine St
- 471 Mc Pheron Ave
- 817 E Eureka St
- 6 Oakwood Place
- 650 S Dewey Ave
- 610 Linden St
- 504 S Shawnee St
Your Personal Tour Guide
Ask me questions while you tour the home.