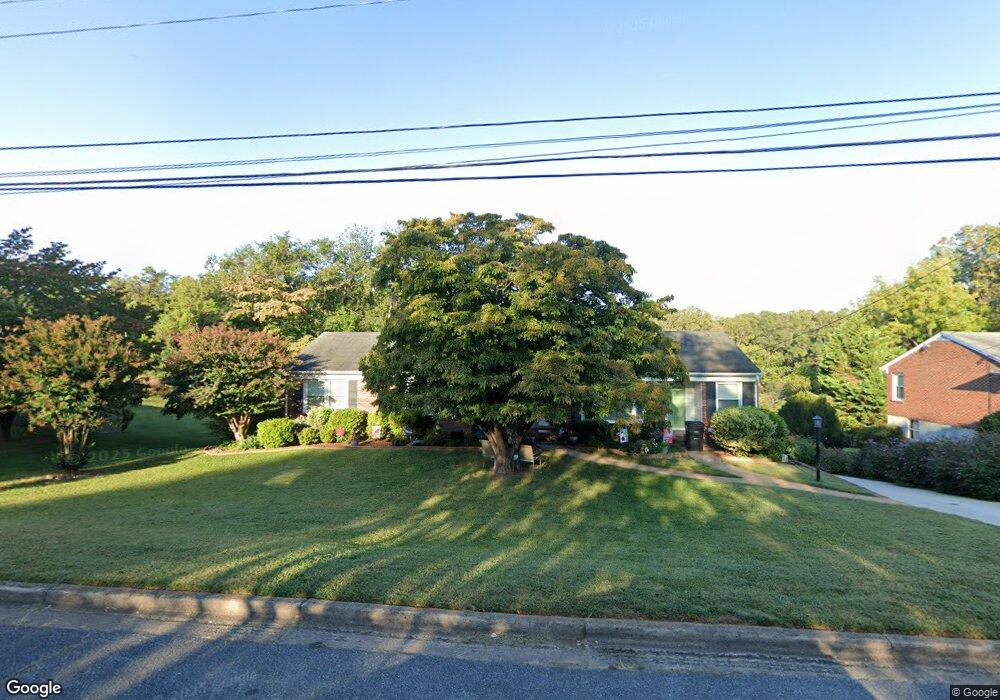
719 Hayes Dr Lynchburg, VA 24502
Sandusky NeighborhoodEstimated Value: $301,527 - $327,000
4
Beds
2
Baths
2,345
Sq Ft
$132/Sq Ft
Est. Value
About This Home
This home is located at 719 Hayes Dr, Lynchburg, VA 24502 and is currently estimated at $310,632, approximately $132 per square foot. 719 Hayes Dr is a home located in Lynchburg City with nearby schools including Sandusky Elementary School, Sandusky Middle School, and Heritage High School.
Ownership History
Date
Name
Owned For
Owner Type
Purchase Details
Closed on
May 3, 2007
Sold by
Jennings Richard A and Jennings Woodrow W
Bought by
Bunn Richard M and Bunn Barbara A
Current Estimated Value
Home Financials for this Owner
Home Financials are based on the most recent Mortgage that was taken out on this home.
Original Mortgage
$174,900
Interest Rate
6.62%
Mortgage Type
Purchase Money Mortgage
Create a Home Valuation Report for This Property
The Home Valuation Report is an in-depth analysis detailing your home's value as well as a comparison with similar homes in the area
Home Values in the Area
Average Home Value in this Area
Purchase History
| Date | Buyer | Sale Price | Title Company |
|---|---|---|---|
| Bunn Richard M | -- | None Available |
Source: Public Records
Mortgage History
| Date | Status | Borrower | Loan Amount |
|---|---|---|---|
| Previous Owner | Bunn Richard M | $174,900 |
Source: Public Records
Tax History Compared to Growth
Tax History
| Year | Tax Paid | Tax Assessment Tax Assessment Total Assessment is a certain percentage of the fair market value that is determined by local assessors to be the total taxable value of land and additions on the property. | Land | Improvement |
|---|---|---|---|---|
| 2025 | $2,408 | $286,700 | $40,000 | $246,700 |
| 2024 | $2,067 | $232,200 | $37,500 | $194,700 |
| 2023 | $2,577 | $232,200 | $37,500 | $194,700 |
| 2022 | $1,884 | $182,900 | $35,000 | $147,900 |
| 2021 | $2,030 | $182,900 | $35,000 | $147,900 |
| 2020 | $1,789 | $161,200 | $32,500 | $128,700 |
| 2019 | $1,789 | $161,200 | $32,500 | $128,700 |
| 2018 | $1,696 | $152,800 | $27,000 | $125,800 |
| 2017 | $1,696 | $152,800 | $27,000 | $125,800 |
| 2016 | $1,696 | $152,800 | $27,000 | $125,800 |
| 2015 | $1,696 | $152,800 | $27,000 | $125,800 |
| 2014 | $1,696 | $160,800 | $27,000 | $133,800 |
Source: Public Records
Map
Nearby Homes
- 916 Sanhill Dr
- 625 Sherman Dr
- 1501 Lynndale Place
- 4637 Fairmont Ave
- 4720 Oakdale Dr
- 5904 Rhonda Rd
- 235 Jordan Ct
- 1117 Long Meadows Dr
- 4815 Myrtle St
- 4632 Golf Park Dr
- 4610 Alabama Ave
- 601 Burton Creek Place
- 214 Jordan Ct
- 4700 Greenwood Dr
- 206 Jordan Ct
- 4812 Windsor Ave
- 4532 Fairmont Ave
- 6401 Pawnee Dr
- 139 Ethan Ct
- 6276 Pawnee Dr