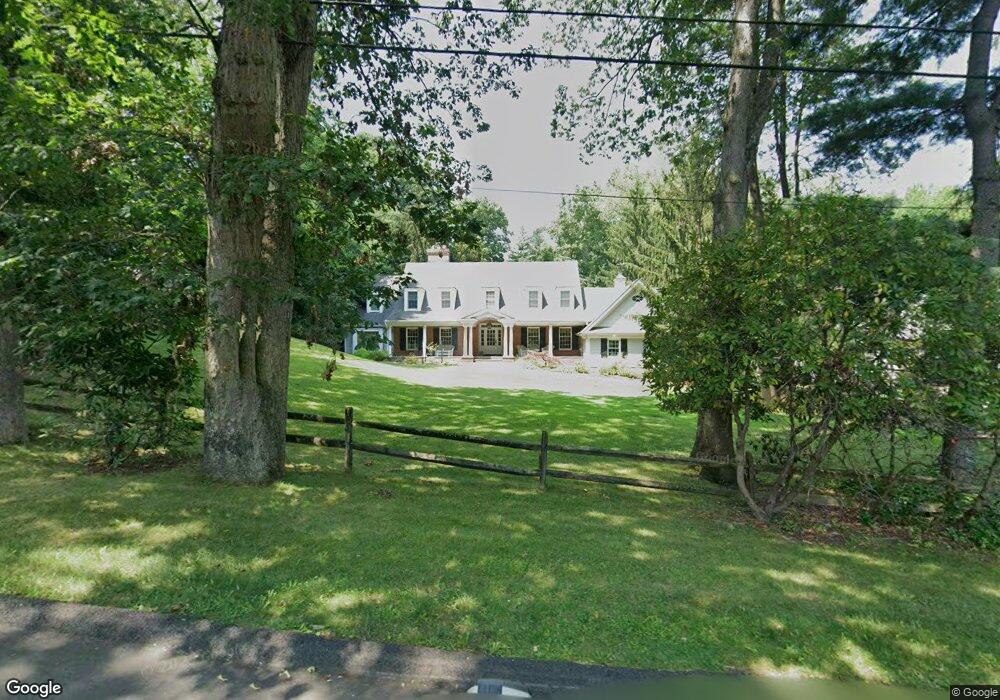
719 Highview Dr Wyckoff, NJ 07481
Estimated Value: $2,001,000 - $2,772,000
--
Bed
--
Bath
4,203
Sq Ft
$532/Sq Ft
Est. Value
About This Home
This home is located at 719 Highview Dr, Wyckoff, NJ 07481 and is currently estimated at $2,235,503, approximately $531 per square foot. 719 Highview Dr is a home located in Bergen County with nearby schools including Sicomac Elementary School, Dwight D Eisenhower Middle School, and Ramapo High School.
Ownership History
Date
Name
Owned For
Owner Type
Purchase Details
Closed on
Nov 19, 2012
Sold by
Deluccia Richard and De Luccia Karen
Bought by
Mclachlan Michael Andrew and Mclachlan Linda Ruth
Current Estimated Value
Home Financials for this Owner
Home Financials are based on the most recent Mortgage that was taken out on this home.
Original Mortgage
$417,000
Outstanding Balance
$256,362
Interest Rate
3.4%
Mortgage Type
Unknown
Estimated Equity
$1,979,141
Purchase Details
Closed on
Mar 12, 1996
Sold by
Portcelli Vito
Bought by
Troy Assoc
Purchase Details
Closed on
May 11, 1995
Sold by
Borst Jeffrey
Bought by
Troy Assoc
Purchase Details
Closed on
May 10, 1995
Sold by
Urban Farms Inc
Bought by
Troy Assoc
Purchase Details
Closed on
Aug 1, 1994
Sold by
Bruan Walter and Bruan Janet
Bought by
Roy Asso
Purchase Details
Closed on
Oct 27, 1993
Sold by
Barrister Construction & Devt
Bought by
Troy Asso
Create a Home Valuation Report for This Property
The Home Valuation Report is an in-depth analysis detailing your home's value as well as a comparison with similar homes in the area
Home Values in the Area
Average Home Value in this Area
Purchase History
| Date | Buyer | Sale Price | Title Company |
|---|---|---|---|
| Mclachlan Michael Andrew | $1,450,000 | -- | |
| Troy Assoc | $302,000 | -- | |
| Troy Assoc | $325,000 | -- | |
| Troy Assoc | $369,900 | -- | |
| Roy Asso | $260,000 | -- | |
| Troy Asso | $290,000 | -- |
Source: Public Records
Mortgage History
| Date | Status | Borrower | Loan Amount |
|---|---|---|---|
| Open | Mclachlan Michael Andrew | $417,000 |
Source: Public Records
Tax History Compared to Growth
Tax History
| Year | Tax Paid | Tax Assessment Tax Assessment Total Assessment is a certain percentage of the fair market value that is determined by local assessors to be the total taxable value of land and additions on the property. | Land | Improvement |
|---|---|---|---|---|
| 2025 | $26,031 | $1,334,900 | $864,400 | $470,500 |
| 2024 | $25,270 | $1,334,900 | $864,400 | $470,500 |
| 2023 | $24,589 | $1,334,900 | $864,400 | $470,500 |
| 2022 | $24,589 | $1,334,900 | $864,400 | $470,500 |
| 2021 | $24,749 | $1,334,900 | $864,400 | $470,500 |
| 2020 | $24,495 | $1,334,900 | $864,400 | $470,500 |
| 2019 | $24,162 | $1,334,900 | $864,400 | $470,500 |
| 2018 | $23,788 | $1,334,900 | $864,400 | $470,500 |
| 2017 | $23,494 | $1,334,900 | $864,400 | $470,500 |
| 2016 | $23,120 | $1,334,900 | $864,400 | $470,500 |
| 2015 | $22,867 | $1,334,900 | $864,400 | $470,500 |
| 2014 | $20,814 | $1,311,500 | $614,400 | $697,100 |
Source: Public Records
Map
Nearby Homes
- 732 Terrace Heights
- 510 Sicomac Ave
- 6 Northwood Dr
- 300 Merrywood Dr
- 740 Van Houten Ave
- 144 Emeline Dr
- 484 Caldwell Dr
- 620 Grandview Terrace
- 587 High Mountain Rd
- 9 Keiller Ct
- 11 Surrey Place Unit 1
- 11 Surrey Place
- 476 Fairfield Rd
- 113 Highview Terrace
- 96 Highland Rd
- 70 Highland Rd
- 113 Highview Ter Land
- 400 Goffle Hill Rd
- 0 Highview Terrace
- 29 Columbia Ct
- 715 Highview Dr
- 723 Highview Dr
- 720 Terrace Heights
- 726 Terrace Heights
- 733 Highview Dr
- 709 Highview Dr
- 724 Highview Dr
- 718 Highview Dr
- 714 Terrace Heights
- 730 Highview Dr
- 703 Highview Dr
- 710 Highview Dr
- 721 Birchwood Dr
- 739 Highview Dr
- 706 Terrace Heights
- 736 Thomas Place
- 731 Birchwood Dr
- 723 Terrace Heights
- 736 Terrace Heights
- 729 Terrace Heights