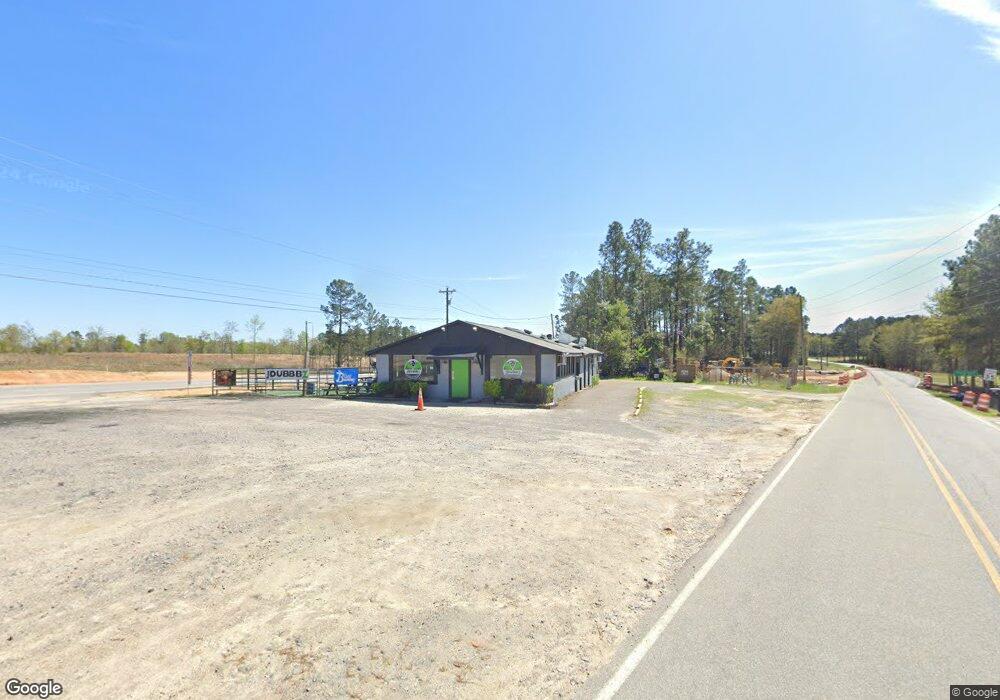
719 Main St N New Ellenton, SC 29809
Estimated Value: $252,371
--
Bed
--
Bath
2,160
Sq Ft
$117/Sq Ft
Est. Value
About This Home
This home is located at 719 Main St N, New Ellenton, SC 29809 and is currently estimated at $252,371, approximately $116 per square foot. 719 Main St N is a home located in Aiken County with nearby schools including Greendale Elementary School, New Ellenton Middle School, and Silver Bluff High School.
Ownership History
Date
Name
Owned For
Owner Type
Purchase Details
Closed on
Apr 30, 2025
Sold by
Rooth Patricia W
Bought by
Dubber Marshall
Current Estimated Value
Home Financials for this Owner
Home Financials are based on the most recent Mortgage that was taken out on this home.
Original Mortgage
$160,000
Outstanding Balance
$157,744
Interest Rate
6.64%
Mortgage Type
Construction
Estimated Equity
$94,627
Purchase Details
Closed on
Apr 27, 2021
Sold by
Rooth Patricia W
Bought by
Department Of Transportation
Purchase Details
Closed on
May 1, 2018
Sold by
Estate Of John Fredrick Rooth
Bought by
Rooth Patricia W
Purchase Details
Closed on
May 30, 2008
Sold by
Bell Gary L and Craig Joanne Y
Bought by
Rooth John F
Purchase Details
Closed on
Feb 28, 2006
Sold by
Bell Gary L and Craig Joanne Y
Bought by
Rooth John F
Home Financials for this Owner
Home Financials are based on the most recent Mortgage that was taken out on this home.
Original Mortgage
$92,500
Interest Rate
6.04%
Mortgage Type
Seller Take Back
Create a Home Valuation Report for This Property
The Home Valuation Report is an in-depth analysis detailing your home's value as well as a comparison with similar homes in the area
Home Values in the Area
Average Home Value in this Area
Purchase History
| Date | Buyer | Sale Price | Title Company |
|---|---|---|---|
| Dubber Marshall | $250,000 | None Listed On Document | |
| Department Of Transportation | $8,000 | None Available | |
| Rooth Patricia W | -- | None Available | |
| Rooth John F | -- | -- | |
| Rooth John F | $185,000 | None Available |
Source: Public Records
Mortgage History
| Date | Status | Borrower | Loan Amount |
|---|---|---|---|
| Open | Dubber Marshall | $160,000 | |
| Previous Owner | Rooth Patricia | $80,000 | |
| Previous Owner | Rooth John F | $92,500 |
Source: Public Records
Tax History Compared to Growth
Tax History
| Year | Tax Paid | Tax Assessment Tax Assessment Total Assessment is a certain percentage of the fair market value that is determined by local assessors to be the total taxable value of land and additions on the property. | Land | Improvement |
|---|---|---|---|---|
| 2023 | $2,286 | $8,960 | $3,240 | $95,280 |
| 2022 | $2,262 | $8,960 | $0 | $0 |
| 2021 | $2,264 | $8,960 | $0 | $0 |
| 2020 | $2,120 | $8,180 | $0 | $0 |
| 2019 | $2,120 | $8,180 | $0 | $0 |
| 2018 | $2,127 | $8,180 | $2,840 | $5,340 |
| 2017 | $1,996 | $0 | $0 | $0 |
| 2016 | $1,982 | $0 | $0 | $0 |
| 2015 | $1,934 | $0 | $0 | $0 |
| 2014 | $1,965 | $0 | $0 | $0 |
| 2013 | -- | $0 | $0 | $0 |
Source: Public Records
Map
Nearby Homes
- 765 Main St N
- 4640 Copper Beech Loop
- 6076 Narnia Cir
- 6086 Narnia Cir
- 6096 Narnia Cir
- 6108 Narnia Cir
- 6118 Narnia Cir
- 6130 Narnia Cir
- 816 Brewer Dr
- 3271 Heartwood Pass
- 3265 Heartwood Pass
- 3257 Heartwood Pass
- Harper II Plan at Whiskey Run
- Bentcreek II Plan at Whiskey Run
- Hidden Creek II Plan at Whiskey Run
- Courtney II Plan at Whiskey Run
- 305 Robinson Dr
- 4152 Fringetree Loop
- 7046 Sideboard Crossing
- 771 Main St N
- 749 Old Whiskey Rd
- 751 Old Whiskey Rd
- 747 Old Whiskey Rd N
- 5271 Whiskey Rd
- 745 Old Whiskey Rd N
- 5120 Whiskey Rd
- 753 Old Whiskey Rd N
- 5230 Whiskey Rd
- 000 Old Whiskey Rd N
- 15 Dry Branch Rd
- 21 Dry Branch Rd
- 5001 Whiskey Rd
- 733 Old Whiskey Rd
- 737 Old Whiskey Rd N
- 5165 Whiskey Rd
- 31 Dry Branch Rd
- 37 Dry Branch Rd
- 39 Dry Branch Rd
- 41 Dry Branch Rd