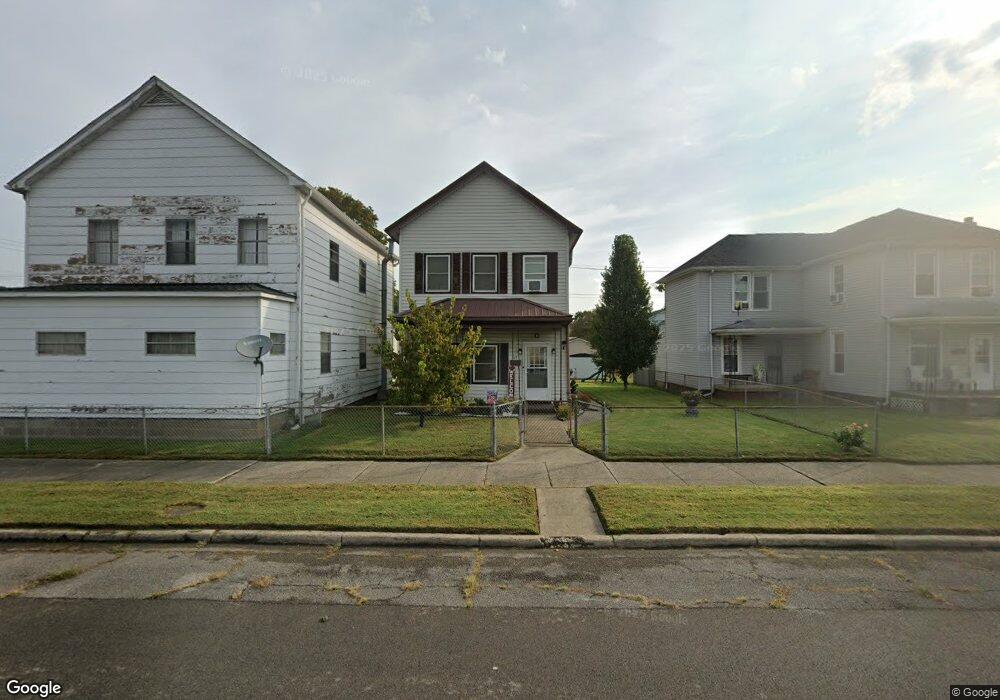
719 N 5th St Ironton, OH 45638
Estimated Value: $61,000 - $104,509
1
Bed
2
Baths
1,260
Sq Ft
$71/Sq Ft
Est. Value
About This Home
This home is located at 719 N 5th St, Ironton, OH 45638 and is currently estimated at $89,627, approximately $71 per square foot. 719 N 5th St is a home located in Lawrence County with nearby schools including Ironton Elementary School, Ironton Middle School, and Ironton High School.
Ownership History
Date
Name
Owned For
Owner Type
Purchase Details
Closed on
Jun 6, 2023
Sold by
Carman Kenneth
Bought by
Carman Kenneth and Carman Norma J
Current Estimated Value
Purchase Details
Closed on
Mar 5, 2020
Sold by
Carman Martha and Carman James S
Bought by
Carman Kenneth
Purchase Details
Closed on
Feb 6, 2019
Sold by
Carman Ruth E Life Est Rem Martha Butler Etal
Bought by
Butler Martha
Purchase Details
Closed on
Dec 18, 1992
Sold by
Carman Ruth
Bought by
Carman Ruth E. Life Est.
Purchase Details
Closed on
Oct 14, 1992
Sold by
Carman James S and Carman Ruth
Bought by
Carman Ruth
Create a Home Valuation Report for This Property
The Home Valuation Report is an in-depth analysis detailing your home's value as well as a comparison with similar homes in the area
Home Values in the Area
Average Home Value in this Area
Purchase History
| Date | Buyer | Sale Price | Title Company |
|---|---|---|---|
| Carman Kenneth | -- | None Listed On Document | |
| Carman Kenneth | -- | None Available | |
| Butler Martha | -- | -- | |
| Carman Ruth E. Life Est. | -- | -- | |
| Carman Ruth | -- | -- |
Source: Public Records
Tax History Compared to Growth
Tax History
| Year | Tax Paid | Tax Assessment Tax Assessment Total Assessment is a certain percentage of the fair market value that is determined by local assessors to be the total taxable value of land and additions on the property. | Land | Improvement |
|---|---|---|---|---|
| 2024 | -- | $25,980 | $7,460 | $18,520 |
| 2023 | $615 | $25,980 | $7,460 | $18,520 |
| 2022 | $963 | $25,980 | $7,460 | $18,520 |
| 2021 | $512 | $13,300 | $6,730 | $6,570 |
| 2020 | $528 | $13,300 | $6,730 | $6,570 |
| 2019 | $849 | $21,720 | $6,730 | $14,990 |
| 2018 | $507 | $21,720 | $6,730 | $14,990 |
| 2017 | $506 | $21,720 | $6,730 | $14,990 |
| 2016 | $473 | $21,720 | $6,730 | $14,990 |
| 2015 | $445 | $20,510 | $6,730 | $13,780 |
| 2014 | $430 | $20,510 | $6,730 | $13,780 |
| 2013 | $429 | $20,510 | $6,730 | $13,780 |
Source: Public Records
Map
Nearby Homes