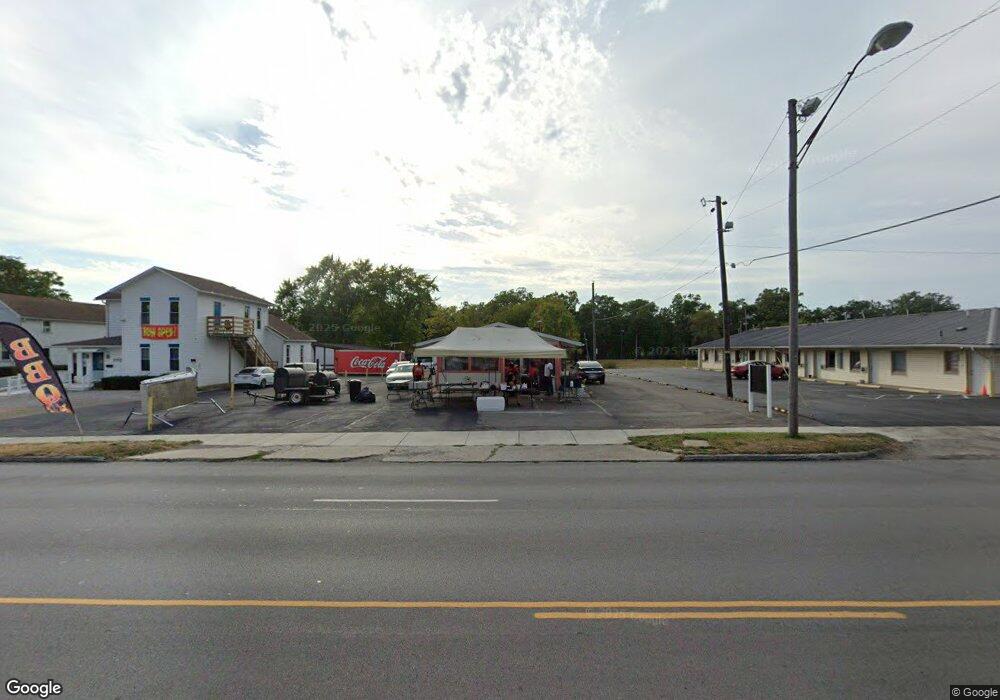
719 N Main St Marion, OH 43302
Estimated Value: $50,526
--
Bed
--
Bath
1,440
Sq Ft
$35/Sq Ft
Est. Value
About This Home
This home is located at 719 N Main St, Marion, OH 43302 and is currently estimated at $50,526, approximately $35 per square foot. 719 N Main St is a home located in Marion County with nearby schools including William H. Taft Elementary School, Ulysses S. Grant Middle School, and Harding High School.
Ownership History
Date
Name
Owned For
Owner Type
Purchase Details
Closed on
Mar 7, 2024
Sold by
719 Main St N Inc
Bought by
Ford Billy
Current Estimated Value
Purchase Details
Closed on
Feb 3, 2014
Sold by
Miller Joseph M and Miller Elizabeth M
Bought by
719 Main St N Inc
Purchase Details
Closed on
Aug 3, 2012
Sold by
Crowe Mindy L
Bought by
Miller Joseph M
Purchase Details
Closed on
May 22, 2007
Sold by
Society For The Handicapped Of Marion Co
Bought by
Crowe Mary I and Crowe Robert P
Home Financials for this Owner
Home Financials are based on the most recent Mortgage that was taken out on this home.
Original Mortgage
$42,500
Interest Rate
6.22%
Mortgage Type
Future Advance Clause Open End Mortgage
Purchase Details
Closed on
Jun 3, 1996
Bought by
719 Main St N Inc
Create a Home Valuation Report for This Property
The Home Valuation Report is an in-depth analysis detailing your home's value as well as a comparison with similar homes in the area
Home Values in the Area
Average Home Value in this Area
Purchase History
| Date | Buyer | Sale Price | Title Company |
|---|---|---|---|
| Ford Billy | $46,000 | None Listed On Document | |
| Ford Billy | $46,000 | None Listed On Document | |
| 719 Main St N Inc | -- | None Available | |
| Miller Joseph M | $38,000 | None Available | |
| Crowe Mary I | $41,000 | Marion Title | |
| 719 Main St N Inc | $53,000 | -- |
Source: Public Records
Mortgage History
| Date | Status | Borrower | Loan Amount |
|---|---|---|---|
| Previous Owner | Crowe Mary I | $42,500 |
Source: Public Records
Tax History Compared to Growth
Tax History
| Year | Tax Paid | Tax Assessment Tax Assessment Total Assessment is a certain percentage of the fair market value that is determined by local assessors to be the total taxable value of land and additions on the property. | Land | Improvement |
|---|---|---|---|---|
| 2024 | $749 | $16,130 | $4,360 | $11,770 |
| 2023 | $749 | $16,130 | $4,360 | $11,770 |
| 2022 | $708 | $16,130 | $4,360 | $11,770 |
| 2021 | $753 | $16,130 | $4,360 | $11,770 |
| 2020 | $779 | $16,130 | $4,360 | $11,770 |
| 2019 | $776 | $16,130 | $4,360 | $11,770 |
| 2018 | $778 | $16,490 | $4,160 | $12,330 |
| 2017 | $781 | $16,490 | $4,160 | $12,330 |
| 2016 | $783 | $16,490 | $4,160 | $12,330 |
| 2015 | $791 | $16,490 | $4,160 | $12,330 |
| 2014 | $792 | $16,490 | $4,160 | $12,330 |
| 2012 | $832 | $17,110 | $3,980 | $13,130 |
Source: Public Records
Map
Nearby Homes
- 736 N Main St
- 197 Harrison St
- 593 N State St
- 197 Wallace St
- 552 N Prospect St
- 524 N State St
- 149 Fairview St
- 551 Universal Ave Unit 555
- 291 Patten St
- 434 N State St
- 455 Park St
- 1015 N Main St
- 395 N Main St
- 375 N Main St
- 749 Richmond Ave
- 592 N Greenwood St
- 347 Mary St
- 236 Silver St
- 343 Commercial St
- 266 Oak St