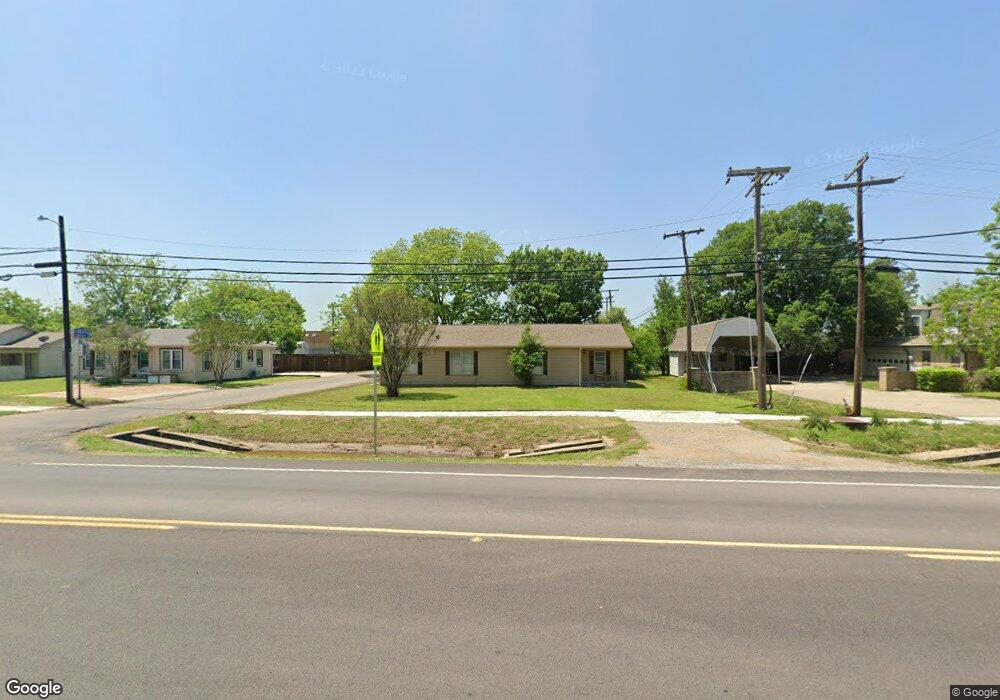
719 N Union St Whitesboro, TX 76273
Estimated Value: $245,655 - $268,000
3
Beds
2
Baths
1,528
Sq Ft
$168/Sq Ft
Est. Value
About This Home
This home is located at 719 N Union St, Whitesboro, TX 76273 and is currently estimated at $256,828, approximately $168 per square foot. 719 N Union St is a home located in Grayson County with nearby schools including J.W. Hayes Primary School, Whitesboro Intermediate School, and Whitesboro Middle School.
Ownership History
Date
Name
Owned For
Owner Type
Purchase Details
Closed on
Apr 8, 2022
Sold by
Dean John M
Bought by
Matthews Adam and Matthews Jana
Current Estimated Value
Home Financials for this Owner
Home Financials are based on the most recent Mortgage that was taken out on this home.
Original Mortgage
$128,000
Outstanding Balance
$112,534
Interest Rate
3.89%
Mortgage Type
New Conventional
Estimated Equity
$144,294
Purchase Details
Closed on
Jul 19, 2012
Sold by
John Dean Properties And Investments Llc
Bought by
Dean John M
Purchase Details
Closed on
Oct 25, 2011
Sold by
Bates Malda Lyn Coulson and Coulson Mark Wayne
Bought by
John Dean Properties & Investments Llc
Purchase Details
Closed on
Apr 19, 2007
Sold by
Coulson Delphene M and Coulson Delphene Monta
Bought by
Bates Malda Lyn Coulson and Coulson Mark Wayne
Create a Home Valuation Report for This Property
The Home Valuation Report is an in-depth analysis detailing your home's value as well as a comparison with similar homes in the area
Home Values in the Area
Average Home Value in this Area
Purchase History
| Date | Buyer | Sale Price | Title Company |
|---|---|---|---|
| Matthews Adam | -- | Red River Title | |
| Dean John M | -- | None Available | |
| John Dean Properties & Investments Llc | -- | None Available | |
| Bates Malda Lyn Coulson | -- | None Available |
Source: Public Records
Mortgage History
| Date | Status | Borrower | Loan Amount |
|---|---|---|---|
| Open | Matthews Adam | $128,000 |
Source: Public Records
Tax History Compared to Growth
Tax History
| Year | Tax Paid | Tax Assessment Tax Assessment Total Assessment is a certain percentage of the fair market value that is determined by local assessors to be the total taxable value of land and additions on the property. | Land | Improvement |
|---|---|---|---|---|
| 2025 | $4,266 | $208,338 | $46,125 | $162,213 |
| 2024 | $4,266 | $216,569 | $45,000 | $171,569 |
| 2023 | $3,978 | $220,673 | $44,100 | $176,573 |
| 2022 | $3,717 | $188,614 | $47,925 | $140,689 |
| 2021 | $3,087 | $143,994 | $31,275 | $112,719 |
| 2020 | $2,268 | $101,590 | $3,200 | $98,390 |
| 2019 | $1,951 | $83,090 | $3,200 | $79,890 |
| 2018 | $1,939 | $81,072 | $3,200 | $77,872 |
| 2017 | $1,544 | $63,807 | $3,200 | $60,607 |
| 2016 | $1,546 | $63,889 | $3,200 | $60,689 |
| 2015 | $0 | $61,660 | $3,200 | $58,460 |
| 2014 | -- | $61,660 | $3,200 | $58,460 |
Source: Public Records
Map
Nearby Homes