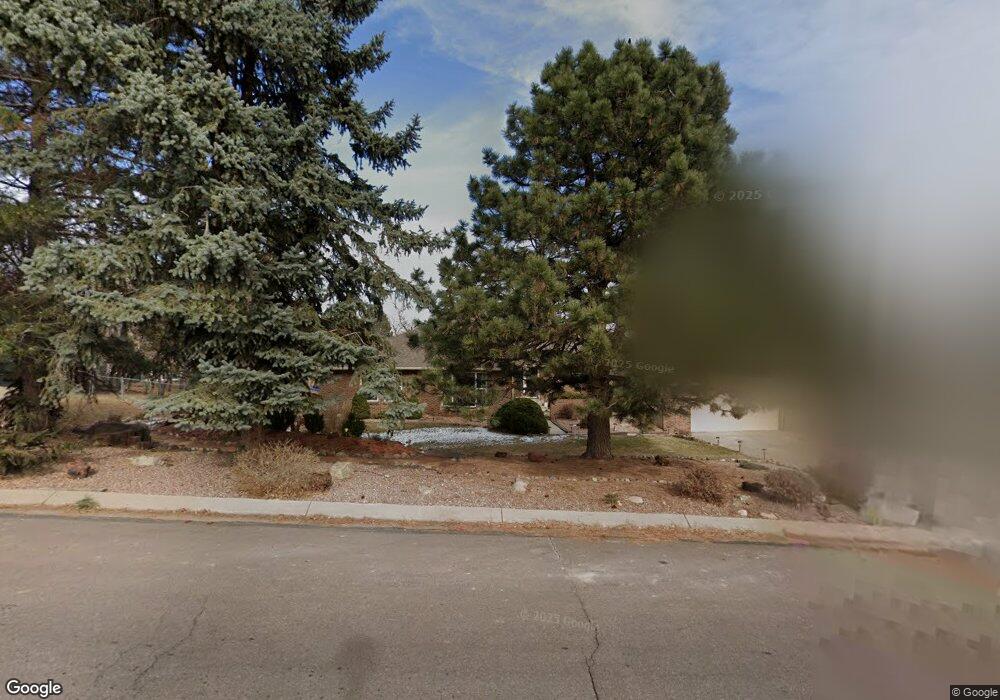
719 Orion Dr Colorado Springs, CO 80906
Skyway NeighborhoodEstimated Value: $787,601 - $1,012,000
4
Beds
4
Baths
2,726
Sq Ft
$329/Sq Ft
Est. Value
About This Home
This home is located at 719 Orion Dr, Colorado Springs, CO 80906 and is currently estimated at $896,900, approximately $329 per square foot. 719 Orion Dr is a home located in El Paso County with nearby schools including Gold Camp Elementary School, Cheyenne Mountain Junior High School, and Cheyenne Mountain High School.
Ownership History
Date
Name
Owned For
Owner Type
Purchase Details
Closed on
May 28, 2020
Sold by
Mann Charles C and Mann Barbara E
Bought by
Cb Mann Family Trust
Current Estimated Value
Purchase Details
Closed on
Aug 1, 2002
Sold by
Maier Laurence M
Bought by
Mann Charles C and Mann Barbara E
Purchase Details
Closed on
Jan 26, 2001
Sold by
Ciletti James A
Bought by
Mann Charles C and Mann Barbara E
Home Financials for this Owner
Home Financials are based on the most recent Mortgage that was taken out on this home.
Original Mortgage
$133,125
Interest Rate
7.21%
Mortgage Type
Stand Alone First
Purchase Details
Closed on
Jan 10, 1994
Sold by
Mann Barbara E
Bought by
Mann Barbara E and Mann Charles C
Home Financials for this Owner
Home Financials are based on the most recent Mortgage that was taken out on this home.
Original Mortgage
$152,500
Interest Rate
7.23%
Purchase Details
Closed on
Nov 1, 1981
Bought by
Mann Barbara E and Mann Charles C
Create a Home Valuation Report for This Property
The Home Valuation Report is an in-depth analysis detailing your home's value as well as a comparison with similar homes in the area
Home Values in the Area
Average Home Value in this Area
Purchase History
| Date | Buyer | Sale Price | Title Company |
|---|---|---|---|
| Cb Mann Family Trust | -- | None Available | |
| Mann Charles C | $138,000 | -- | |
| Mann Charles C | $177,500 | -- | |
| Mann Barbara E | -- | -- | |
| Mann Barbara E | -- | -- |
Source: Public Records
Mortgage History
| Date | Status | Borrower | Loan Amount |
|---|---|---|---|
| Previous Owner | Mann Charles C | $133,125 | |
| Previous Owner | Mann Barbara E | $152,500 |
Source: Public Records
Tax History Compared to Growth
Tax History
| Year | Tax Paid | Tax Assessment Tax Assessment Total Assessment is a certain percentage of the fair market value that is determined by local assessors to be the total taxable value of land and additions on the property. | Land | Improvement |
|---|---|---|---|---|
| 2025 | $3,434 | $58,530 | -- | -- |
| 2024 | $2,866 | $53,410 | $10,050 | $43,360 |
| 2023 | $2,866 | $53,410 | $10,050 | $43,360 |
| 2022 | $2,273 | $40,310 | $8,410 | $31,900 |
| 2021 | $2,401 | $41,470 | $8,650 | $32,820 |
| 2020 | $2,128 | $36,800 | $7,720 | $29,080 |
| 2019 | $2,104 | $36,800 | $7,720 | $29,080 |
| 2018 | $1,742 | $31,300 | $6,830 | $24,470 |
| 2017 | $1,735 | $31,300 | $6,830 | $24,470 |
| 2016 | $1,673 | $31,830 | $7,160 | $24,670 |
| 2015 | $1,670 | $31,830 | $7,160 | $24,670 |
| 2014 | $1,545 | $30,030 | $7,160 | $22,870 |
Source: Public Records
Map
Nearby Homes
- 707 Orion Dr
- 705 Orion Dr
- 2302 Hercules Dr
- 2419 Astron Dr
- 2437 Virgo Dr
- 2915 Pegasus Dr
- 2771 Rigel Dr
- 1828 Parkview Blvd
- 1810 Brantfeather Grove
- 625 Vista Grande Dr
- 506 Orion Place
- 1915 Cantwell Grove
- 2845 Halleys Ct
- 1035 Beta Loop
- 1675 Little Bear Creek Point Unit 4
- 351 Bergamo Way
- 1635 Little Bear Creek Point Unit 5
- 1975 Fox Mountain Point
- 1510 Little Bear Creek Point Unit 202
- 2186 Giltshire Dr
- 715 Orion Dr
- 721 Orion Dr
- 709 Orion Dr
- 735 Crestfield Grove
- 720 Orion Dr
- 718 Orion Dr
- 716 Orion Dr
- 714 Orion Dr
- 725 Crestfield Grove
- 712 Orion Dr
- 724 Orion Dr
- 2460 Scorpio Dr
- 710 Orion Dr
- 720 Crestfield Grove
- 703 Orion Dr
- 730 Crestfield Grove
- 708 Scorpio Cir
- 725 Orion Dr
- 750 Crestfield Grove
- 712 Scorpio Cir