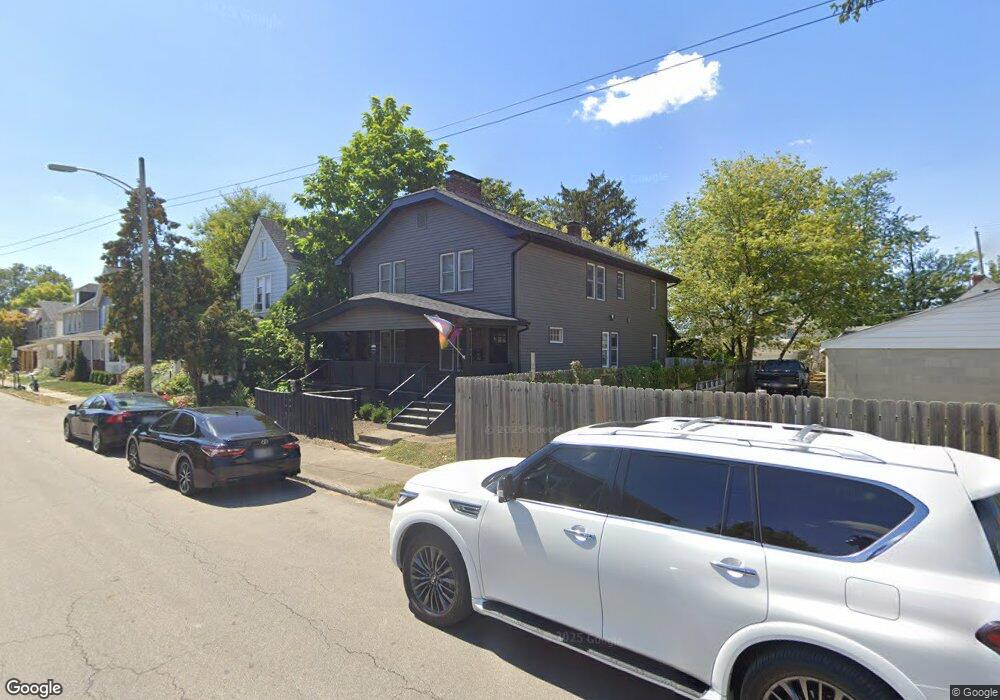
719 S 17th St Unit 721 Columbus, OH 43206
Southern Orchards NeighborhoodEstimated Value: $261,000 - $396,000
3
Beds
2
Baths
1,176
Sq Ft
$287/Sq Ft
Est. Value
About This Home
This home is located at 719 S 17th St Unit 721, Columbus, OH 43206 and is currently estimated at $337,715, approximately $287 per square foot. 719 S 17th St Unit 721 is a home located in Franklin County with nearby schools including Livingston Elementary School, South High School, and South Columbus Preparatory Academy.
Ownership History
Date
Name
Owned For
Owner Type
Purchase Details
Closed on
Oct 14, 2025
Sold by
Wheeler Lacey D and Wheeler Audra E
Bought by
719 S 17Th Llc
Current Estimated Value
Purchase Details
Closed on
Apr 6, 2021
Sold by
Anderson Tammy P and Anderson Warren W
Bought by
Wheeler Lacey D and Wheeler Audra E
Purchase Details
Closed on
Feb 24, 2016
Sold by
Anderson Warren W and Anderson Tammy P
Bought by
Anderson Warren W
Home Financials for this Owner
Home Financials are based on the most recent Mortgage that was taken out on this home.
Original Mortgage
$70,000
Interest Rate
3.92%
Mortgage Type
Seller Take Back
Purchase Details
Closed on
Jan 7, 2013
Sold by
Blazer Kaci R and Anderson Kaci R
Bought by
Anderson Warren W
Purchase Details
Closed on
Jun 28, 2006
Sold by
Anderson Steven D
Bought by
Anderson Kaci R
Purchase Details
Closed on
Jun 4, 1993
Bought by
Anderson Steven D
Purchase Details
Closed on
Dec 4, 1992
Purchase Details
Closed on
Oct 13, 1988
Create a Home Valuation Report for This Property
The Home Valuation Report is an in-depth analysis detailing your home's value as well as a comparison with similar homes in the area
Home Values in the Area
Average Home Value in this Area
Purchase History
| Date | Buyer | Sale Price | Title Company |
|---|---|---|---|
| 719 S 17Th Llc | -- | None Listed On Document | |
| Wheeler Lacey D | $175,000 | Pm Title Llc | |
| Anderson Tammy P | -- | Pm Title Llc | |
| Anderson Warren W | -- | None Available | |
| Anderson Warren W | $31,000 | None Available | |
| Anderson Kaci R | $34,500 | None Available | |
| Anderson Steven D | $30,000 | -- | |
| -- | $32,000 | -- | |
| -- | $21,900 | -- |
Source: Public Records
Mortgage History
| Date | Status | Borrower | Loan Amount |
|---|---|---|---|
| Previous Owner | Anderson Warren W | $70,000 |
Source: Public Records
Tax History
| Year | Tax Paid | Tax Assessment Tax Assessment Total Assessment is a certain percentage of the fair market value that is determined by local assessors to be the total taxable value of land and additions on the property. | Land | Improvement |
|---|---|---|---|---|
| 2025 | $4,034 | $88,030 | $30,240 | $57,790 |
| 2024 | $4,034 | $88,030 | $30,240 | $57,790 |
| 2023 | $3,984 | $88,025 | $30,240 | $57,785 |
| 2022 | $2,288 | $43,060 | $6,620 | $36,440 |
| 2021 | $1,335 | $34,030 | $6,620 | $27,410 |
| 2020 | $1,487 | $34,030 | $6,620 | $27,410 |
| 2019 | $1,075 | $26,150 | $5,080 | $21,070 |
| 2018 | $1,188 | $26,150 | $5,080 | $21,070 |
| 2017 | $1,125 | $26,150 | $5,080 | $21,070 |
| 2016 | $1,174 | $17,500 | $4,480 | $13,020 |
| 2015 | $1,303 | $20,550 | $4,480 | $16,070 |
| 2014 | $1,256 | $20,550 | $4,480 | $16,070 |
| 2013 | $653 | $21,630 | $4,725 | $16,905 |
Source: Public Records
Map
Nearby Homes
- 676 Wager St
- 741 Heyl Ave
- 751 Wager St
- 827 S 17th St
- 841 Ann St
- 800 Carpenter St
- 863 Carpenter St
- 517 Forest St
- 903 E Livingston Ave
- 904 E Livingston Ave
- 630 Stanley Ave
- 711 S 22nd St
- 870 Gilbert St
- 466 South Ln
- 867 S 22nd St
- 640 E Whittier St
- 497 E Kossuth St
- 662 S 22nd St Unit 664
- 960 Carpenter St
- 795 S Ohio Ave
Your Personal Tour Guide
Ask me questions while you tour the home.