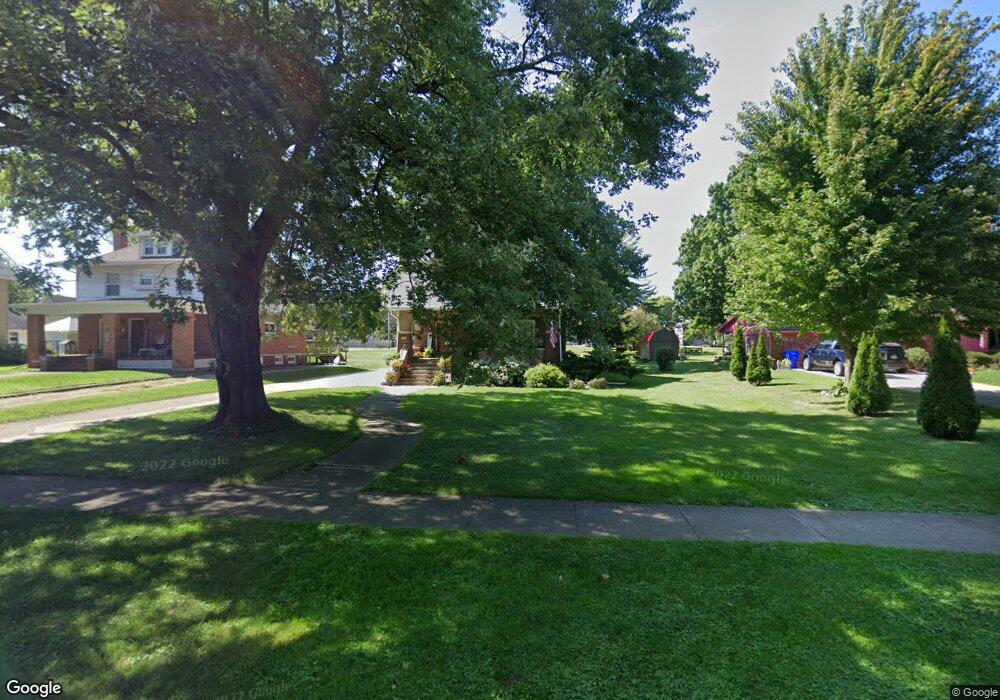
719 S Chestnut St Kewanee, IL 61443
Estimated Value: $162,000 - $206,000
3
Beds
2
Baths
2,309
Sq Ft
$77/Sq Ft
Est. Value
About This Home
This home is located at 719 S Chestnut St, Kewanee, IL 61443 and is currently estimated at $178,859, approximately $77 per square foot. 719 S Chestnut St is a home located in Henry County with nearby schools including Kewanee High School and Visitation Catholic School.
Ownership History
Date
Name
Owned For
Owner Type
Purchase Details
Closed on
Feb 10, 2016
Sold by
Cernovich John S and Cernovich Nicole L
Bought by
Jackson Chad A and Jackson Rosa A
Current Estimated Value
Home Financials for this Owner
Home Financials are based on the most recent Mortgage that was taken out on this home.
Original Mortgage
$128,092
Outstanding Balance
$102,672
Interest Rate
4.12%
Mortgage Type
VA
Estimated Equity
$76,187
Purchase Details
Closed on
Dec 5, 2008
Sold by
Stalzer William M and Stalzer Joy C
Bought by
Cernovich John S
Home Financials for this Owner
Home Financials are based on the most recent Mortgage that was taken out on this home.
Original Mortgage
$88,000
Interest Rate
6.49%
Mortgage Type
New Conventional
Create a Home Valuation Report for This Property
The Home Valuation Report is an in-depth analysis detailing your home's value as well as a comparison with similar homes in the area
Home Values in the Area
Average Home Value in this Area
Purchase History
| Date | Buyer | Sale Price | Title Company |
|---|---|---|---|
| Jackson Chad A | $124,000 | Attorney | |
| Cernovich John S | $110,000 | None Available |
Source: Public Records
Mortgage History
| Date | Status | Borrower | Loan Amount |
|---|---|---|---|
| Open | Jackson Chad A | $128,092 | |
| Previous Owner | Cernovich John S | $88,000 |
Source: Public Records
Tax History Compared to Growth
Tax History
| Year | Tax Paid | Tax Assessment Tax Assessment Total Assessment is a certain percentage of the fair market value that is determined by local assessors to be the total taxable value of land and additions on the property. | Land | Improvement |
|---|---|---|---|---|
| 2024 | $5,161 | $53,814 | $4,574 | $49,240 |
| 2023 | $4,614 | $47,623 | $4,048 | $43,575 |
| 2022 | $4,094 | $42,352 | $3,683 | $38,669 |
| 2021 | $3,863 | $39,215 | $3,410 | $35,805 |
| 2020 | $3,781 | $38,352 | $3,335 | $35,017 |
| 2019 | $3,876 | $40,016 | $3,480 | $36,536 |
| 2018 | $3,926 | $40,184 | $3,566 | $36,618 |
| 2017 | $3,856 | $39,668 | $3,520 | $36,148 |
| 2016 | $4,584 | $40,069 | $3,556 | $36,513 |
| 2015 | $2,493 | $39,400 | $3,497 | $35,903 |
| 2013 | $2,493 | $27,767 | $3,586 | $24,181 |
Source: Public Records
Map
Nearby Homes
- 622 S Tremont St
- 714 S Main St
- 713 Henry St
- 115 Roosevelt Ave
- 402 W Prospect St
- 216 Hillcrest Dr
- 237 W Mill St
- 516 W Prospect St
- 206 Roosevelt Ave
- 323 S Chestnut St
- 235 S Chestnut St
- 338 Hollis St
- 405 Mckinley Ave
- 213 Elliott St
- 300 Beach St S
- 201 S Grove St
- 414 E Oak St
- 512 Commercial St
- 315 E Mcclure St
- 712 Roosevelt Ave
- 725 S Chestnut St
- 705 S Chestnut St
- 727 S Chestnut St
- 312 W Division St
- 316 W Division St
- 733 S Chestnut St
- 320 W Division St
- 714 S Chestnut St
- 710 S Chestnut St
- 324 W Division St
- 722 S Chestnut St
- 704 S Chestnut St
- 726 S Chestnut St
- 702 S Chestnut St
- 617 S Chestnut St
- 328 W Division St
- 730 S Chestnut St
- 716 Elliott St
- 700 S Chestnut St
- 622 Elliott St Unit 624