Estimated Value: $160,106 - $212,000
3
Beds
2
Baths
1,943
Sq Ft
$93/Sq Ft
Est. Value
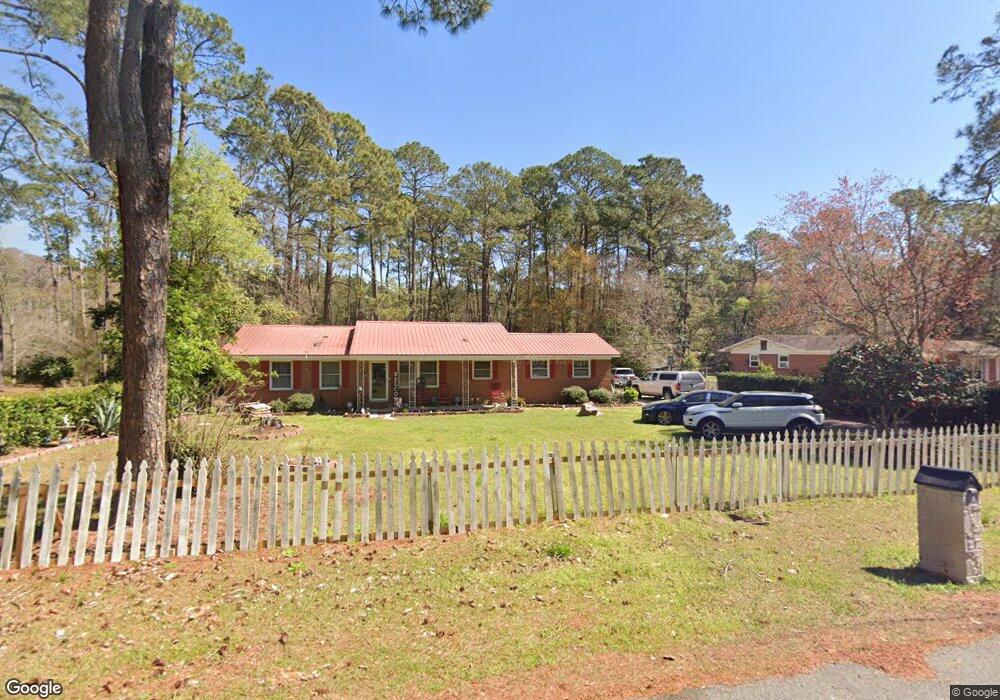
About This Home
This home is located at 719 S Forrest Ave, Adel, GA 31620 and is currently estimated at $181,277, approximately $93 per square foot. 719 S Forrest Ave is a home located in Cook County with nearby schools including Cook Primary School, Cook Elementary School, and Cook County Middle School.
Ownership History
Date
Name
Owned For
Owner Type
Purchase Details
Closed on
Aug 19, 2021
Sold by
Brown Lucinda S
Bought by
Brown Portia
Current Estimated Value
Purchase Details
Closed on
Apr 8, 2014
Sold by
Nehemiah Community Reinves
Bought by
Brown Lucinda
Home Financials for this Owner
Home Financials are based on the most recent Mortgage that was taken out on this home.
Original Mortgage
$58,500
Interest Rate
3.46%
Mortgage Type
New Conventional
Purchase Details
Closed on
Aug 9, 2013
Sold by
J Paradice Properties Llc
Bought by
Nehemiah Community Reinvestmen
Purchase Details
Closed on
Jan 2, 2013
Sold by
Edwards Vontessa R
Bought by
Bank Of America
Purchase Details
Closed on
Jul 18, 2007
Sold by
Prudential Relocation Inc
Bought by
Tcgt Inc
Create a Home Valuation Report for This Property
The Home Valuation Report is an in-depth analysis detailing your home's value as well as a comparison with similar homes in the area
Home Values in the Area
Average Home Value in this Area
Purchase History
| Date | Buyer | Sale Price | Title Company |
|---|---|---|---|
| Brown Portia | -- | -- | |
| Brown Lucinda | $62,500 | -- | |
| Nehemiah Community Reinvestmen | $50,700 | -- | |
| J Paradice Properties Llc | $46,665 | -- | |
| Bank Of America | -- | -- | |
| Tcgt Inc | $70,000 | -- | |
| Prudential Relocation Inc | $70,000 | -- |
Source: Public Records
Mortgage History
| Date | Status | Borrower | Loan Amount |
|---|---|---|---|
| Previous Owner | Brown Lucinda | $58,500 |
Source: Public Records
Tax History
| Year | Tax Paid | Tax Assessment Tax Assessment Total Assessment is a certain percentage of the fair market value that is determined by local assessors to be the total taxable value of land and additions on the property. | Land | Improvement |
|---|---|---|---|---|
| 2025 | $1,164 | $37,733 | $6,376 | $31,357 |
| 2024 | $1,197 | $36,344 | $5,040 | $31,304 |
| 2023 | $1,050 | $31,886 | $4,500 | $27,386 |
| 2022 | $1,050 | $31,886 | $4,500 | $27,386 |
| 2021 | $969 | $27,473 | $4,500 | $22,973 |
| 2020 | $969 | $27,473 | $4,500 | $22,973 |
| 2019 | $969 | $27,473 | $4,500 | $22,973 |
| 2018 | $970 | $27,473 | $4,500 | $22,973 |
| 2017 | $970 | $27,473 | $4,500 | $22,973 |
| 2016 | $972 | $27,473 | $4,500 | $22,973 |
| 2015 | $885 | $27,473 | $4,500 | $22,973 |
| 2014 | $719 | $40,286 | $6,250 | $34,036 |
| 2013 | -- | $40,286 | $6,250 | $34,036 |
Source: Public Records
Map
Nearby Homes
- 806 S Forrest Ave
- 804 S Forrest Ave
- 413 Honeysuckle Way
- 321 Spanish Moss Ln
- 513 Spanish Moss Ln
- 509 E 8th St
- 317 Brookside Dr
- 411 S Hutchinson Ave
- 322 Magnolia Dr
- 211 S Gordon Ave
- 507 S Poplar St
- 609 E 4th St
- 708 Town And Country Dr
- 315 Newton Dr
- 729 W 7th St
- 701 Gloria St
- 3 Caulie Harris Rd
- 814 N Cleveland Ave
- 309 Wayne St
- 11 Antioch Rd
- 00 S Forrest Ave
- 723 S Forrest Ave
- 711 S Forrest Ave
- 724 S Forrest Ave
- 802 S Forrest Ave
- 721 Laurel Ave
- 710 S Forrest Ave
- 805 S Forrest Ave
- 723 Laurel Ave
- 701 S Forrest Ave
- 805 Laurel Ave
- 805 S Laurel Ave
- 504 E 10th St
- 803 S Forrest Ave
- 407 E 11th St
- 716 Laurel Ave
- 615 S Forrest Ave
- 800 Laurel Ave
- 712 Laurel Ave
- 811 Laurel Ave
Your Personal Tour Guide
Ask me questions while you tour the home.