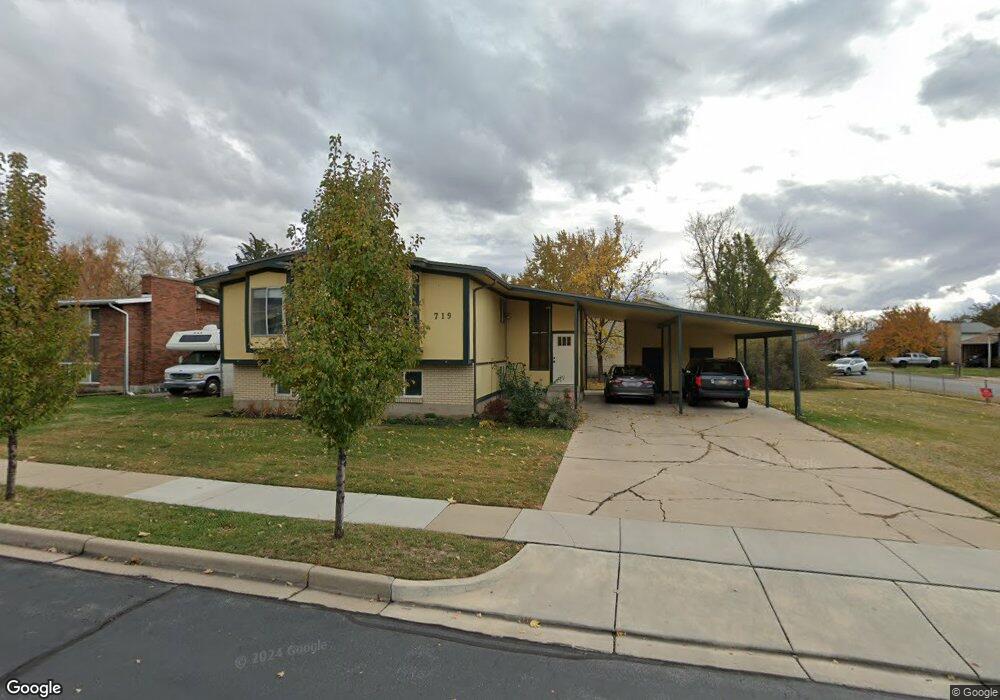
719 W 1550 N West Bountiful, UT 84087
Estimated Value: $498,000 - $527,000
4
Beds
3
Baths
2,374
Sq Ft
$217/Sq Ft
Est. Value
About This Home
This home is located at 719 W 1550 N, West Bountiful, UT 84087 and is currently estimated at $515,143, approximately $216 per square foot. 719 W 1550 N is a home located in Davis County with nearby schools including West Bountiful Elementary School, Bountiful Junior High School, and Viewmont High School.
Ownership History
Date
Name
Owned For
Owner Type
Purchase Details
Closed on
May 23, 2016
Sold by
Rogers Brian Y
Bought by
Rogers Brian Y and Rogers Helen C
Current Estimated Value
Purchase Details
Closed on
Jan 22, 1999
Sold by
Armstrong Louise
Bought by
Rogers Brian Y and Rogers Helen C
Create a Home Valuation Report for This Property
The Home Valuation Report is an in-depth analysis detailing your home's value as well as a comparison with similar homes in the area
Home Values in the Area
Average Home Value in this Area
Purchase History
| Date | Buyer | Sale Price | Title Company |
|---|---|---|---|
| Rogers Brian Y | -- | Inwest Title | |
| Rogers Brian Y | -- | Inwest Title | |
| Rogers Brian Y | -- | Associated Title Company |
Source: Public Records
Tax History Compared to Growth
Tax History
| Year | Tax Paid | Tax Assessment Tax Assessment Total Assessment is a certain percentage of the fair market value that is determined by local assessors to be the total taxable value of land and additions on the property. | Land | Improvement |
|---|---|---|---|---|
| 2025 | $2,985 | $257,400 | $122,575 | $134,825 |
| 2024 | $2,788 | $246,400 | $100,516 | $145,884 |
| 2023 | $2,656 | $431,000 | $192,162 | $238,838 |
| 2022 | $2,715 | $246,950 | $90,583 | $156,367 |
| 2021 | $2,433 | $339,000 | $119,321 | $219,679 |
| 2020 | $2,334 | $285,000 | $112,969 | $172,031 |
| 2019 | $2,202 | $276,000 | $115,811 | $160,189 |
| 2018 | $2,022 | $256,000 | $118,854 | $137,146 |
| 2016 | $1,680 | $118,360 | $28,523 | $89,837 |
| 2015 | $1,613 | $108,020 | $28,523 | $79,497 |
| 2014 | $1,535 | $101,577 | $28,242 | $73,335 |
| 2013 | -- | $97,202 | $23,559 | $73,643 |
Source: Public Records
Map
Nearby Homes
- 637 W 1600 N
- 825 W 1320 N
- Lincoln Farmhouse Plan at Belmont Farms
- Belmont Traditional Plan at Belmont Farms
- Hampton Traditional Plan at Belmont Farms
- 1084 W Audrey Ln Unit 20
- 1084 W Audrey Ln
- 988 W 1950 N Unit 134
- 2257 N 830 W
- 668 W 2300 N
- 366 W 1000 N
- 548 S 675 W
- 790 N 500 W
- 235 W 1400 N
- 239 Lyman Ln
- 234 Leah Cir
- 1552 N 200 W
- 1410 N 200 W
- 1194 N 200 W
- 1260 N 200 W