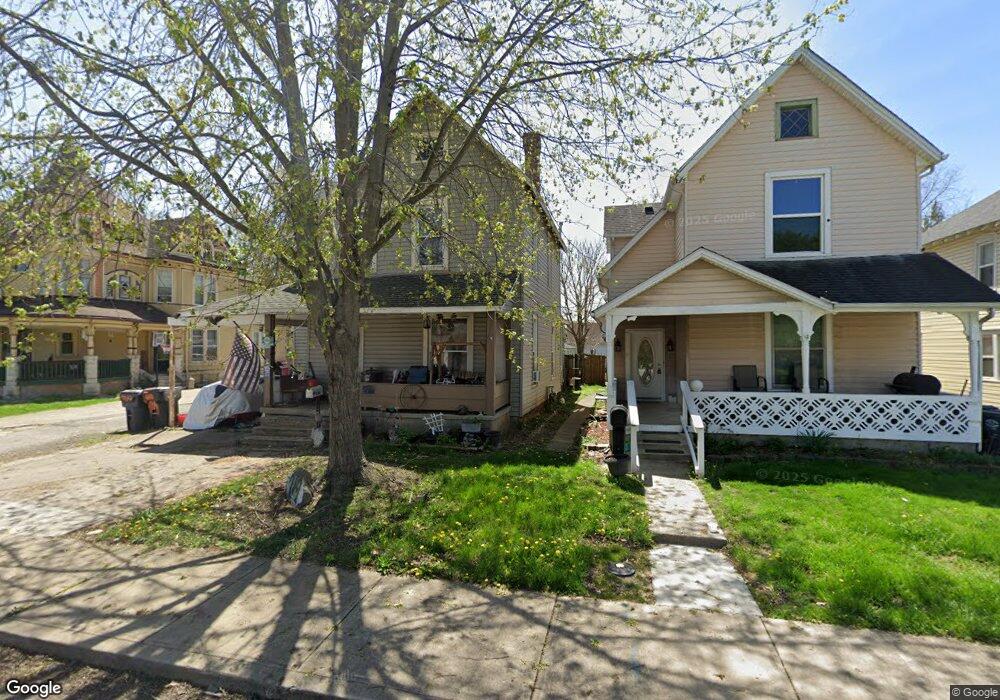
719 W 9th St Anderson, IN 46016
Estimated Value: $74,000 - $155,000
3
Beds
2
Baths
2,585
Sq Ft
$45/Sq Ft
Est. Value
About This Home
This home is located at 719 W 9th St, Anderson, IN 46016 and is currently estimated at $117,377, approximately $45 per square foot. 719 W 9th St is a home located in Madison County with nearby schools including Tenth Street Elementary School, Highland Middle School, and Anderson High School.
Ownership History
Date
Name
Owned For
Owner Type
Purchase Details
Closed on
Apr 11, 2007
Sold by
Federal National Mortgage Association
Bought by
Griffin Terri L Bodkin
Current Estimated Value
Purchase Details
Closed on
Dec 21, 2006
Sold by
Phh Mortgage Corp
Bought by
Federal National Mortgage Association
Purchase Details
Closed on
Dec 15, 2006
Sold by
Richwine Terry
Bought by
Phh Mortgage Corp and Cendant Mortgage Corporation
Create a Home Valuation Report for This Property
The Home Valuation Report is an in-depth analysis detailing your home's value as well as a comparison with similar homes in the area
Home Values in the Area
Average Home Value in this Area
Purchase History
| Date | Buyer | Sale Price | Title Company |
|---|---|---|---|
| Griffin Terri L Bodkin | -- | -- | |
| Federal National Mortgage Association | -- | -- | |
| Phh Mortgage Corp | $80,512 | -- |
Source: Public Records
Tax History Compared to Growth
Tax History
| Year | Tax Paid | Tax Assessment Tax Assessment Total Assessment is a certain percentage of the fair market value that is determined by local assessors to be the total taxable value of land and additions on the property. | Land | Improvement |
|---|---|---|---|---|
| 2024 | $856 | $81,000 | $6,200 | $74,800 |
| 2023 | $781 | $73,900 | $5,900 | $68,000 |
| 2022 | $753 | $74,400 | $5,800 | $68,600 |
| 2021 | $715 | $67,800 | $5,800 | $62,000 |
| 2020 | $680 | $64,700 | $5,500 | $59,200 |
| 2019 | $665 | $63,000 | $5,500 | $57,500 |
| 2018 | $615 | $57,800 | $5,500 | $52,300 |
| 2017 | $568 | $57,100 | $5,500 | $51,600 |
| 2016 | $556 | $57,100 | $5,500 | $51,600 |
| 2014 | $513 | $56,300 | $6,300 | $50,000 |
| 2013 | $513 | $56,300 | $6,300 | $50,000 |
Source: Public Records
Map
Nearby Homes