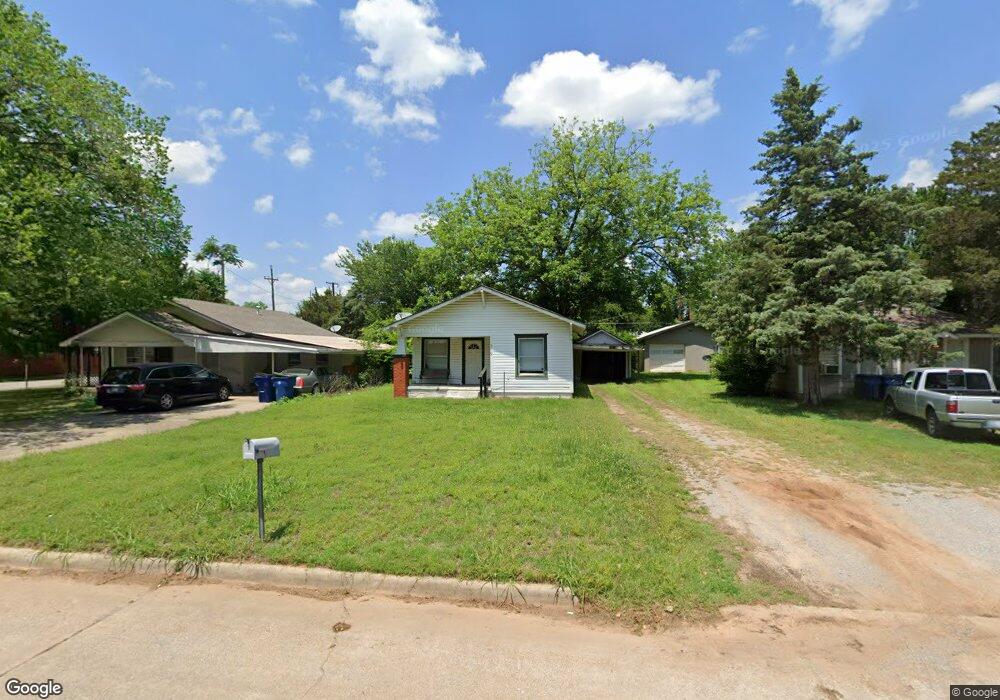
719 W Spruce Ave Duncan, OK 73533
Estimated Value: $50,274 - $57,000
2
Beds
1
Bath
774
Sq Ft
$69/Sq Ft
Est. Value
About This Home
This home is located at 719 W Spruce Ave, Duncan, OK 73533 and is currently estimated at $53,069, approximately $68 per square foot. 719 W Spruce Ave is a home located in Stephens County with nearby schools including Emerson Elementary School, Duncan Middle School, and Duncan High School.
Ownership History
Date
Name
Owned For
Owner Type
Purchase Details
Closed on
Sep 10, 2012
Sold by
Arbuckle Andy J and Arbuckle Leah
Bought by
Mth Properties Llc
Current Estimated Value
Home Financials for this Owner
Home Financials are based on the most recent Mortgage that was taken out on this home.
Original Mortgage
$17,332
Interest Rate
3.49%
Mortgage Type
Purchase Money Mortgage
Purchase Details
Closed on
Sep 18, 2008
Sold by
Haugh Joseph A and Haugh Joseph Alfred
Bought by
Arbuckle Andy J
Home Financials for this Owner
Home Financials are based on the most recent Mortgage that was taken out on this home.
Original Mortgage
$21,558
Interest Rate
6.6%
Mortgage Type
Purchase Money Mortgage
Purchase Details
Closed on
Sep 6, 2002
Sold by
Fullerton David A and Fullerton Wife
Purchase Details
Closed on
Dec 11, 1995
Sold by
Fullerton Michael A
Create a Home Valuation Report for This Property
The Home Valuation Report is an in-depth analysis detailing your home's value as well as a comparison with similar homes in the area
Home Values in the Area
Average Home Value in this Area
Purchase History
| Date | Buyer | Sale Price | Title Company |
|---|---|---|---|
| Mth Properties Llc | $18,500 | None Available | |
| Arbuckle Andy J | $25,000 | None Available | |
| -- | $21,000 | -- | |
| -- | $11,000 | -- |
Source: Public Records
Mortgage History
| Date | Status | Borrower | Loan Amount |
|---|---|---|---|
| Closed | Mth Properties Llc | $17,332 | |
| Previous Owner | Arbuckle Andy J | $21,558 |
Source: Public Records
Tax History Compared to Growth
Tax History
| Year | Tax Paid | Tax Assessment Tax Assessment Total Assessment is a certain percentage of the fair market value that is determined by local assessors to be the total taxable value of land and additions on the property. | Land | Improvement |
|---|---|---|---|---|
| 2025 | $159 | $1,954 | $269 | $1,685 |
| 2024 | $159 | $1,861 | $269 | $1,592 |
| 2023 | $159 | $1,772 | $269 | $1,503 |
| 2022 | $173 | $2,134 | $269 | $1,865 |
| 2021 | $173 | $2,032 | $269 | $1,763 |
| 2020 | $159 | $1,843 | $269 | $1,574 |
| 2019 | $201 | $2,325 | $269 | $2,056 |
| 2018 | $215 | $2,409 | $269 | $2,140 |
| 2017 | $202 | $2,473 | $269 | $2,204 |
| 2016 | $191 | $2,243 | $269 | $1,974 |
| 2015 | $237 | $2,136 | $269 | $1,867 |
| 2014 | $237 | $2,036 | $501 | $1,535 |
Source: Public Records
Map
Nearby Homes
- 705 W Hackberry Ave
- 1001 1001 W Hackberry
- 1444 N 8th St
- 805 805 N 5th
- 1112 N 5th St
- 1112 1112 N 12th
- 1112 W Spruce St
- 810 810 N 12th St
- 1312 Pkwy
- 1105 N Grand Blvd
- 1202 N Grand Blvd
- 1213 W Pine Ave
- 1114 N 13th St
- 1105 W Beech Ave
- 1213 Avalon Ave
- 1116 1116 W Chestnut
- 1229 Avalon Ave
- 101 W Hackberry Ave
- 815 N 14th St
- 312 W Beech Ave
- 717 W Spruce Ave
- 721 W Spruce Ave
- 715 W Spruce Ave
- 910 N 8th St
- 713 W Spruce Ave
- 716 W Hackberry Ave
- 801 W Spruce Ave
- 714 W Hackberry Ave
- 912 N 8th St
- 711 W Spruce Ave
- 818 N 8th St
- 712 W Hackberry Ave
- 716 W Spruce Ave
- 909 N 8th St
- 714 W Spruce Ave
- 805 W Spruce Ave
- 707 W Spruce Ave
- 710 W Hackberry Ave
- 911 N 8th St
- 817 N 8th St