
Seller's Agent in 2025
Amy Gworek
William Raveis R.E. & Home Services
(617) 571-2390
22 in this area
44 Total Sales
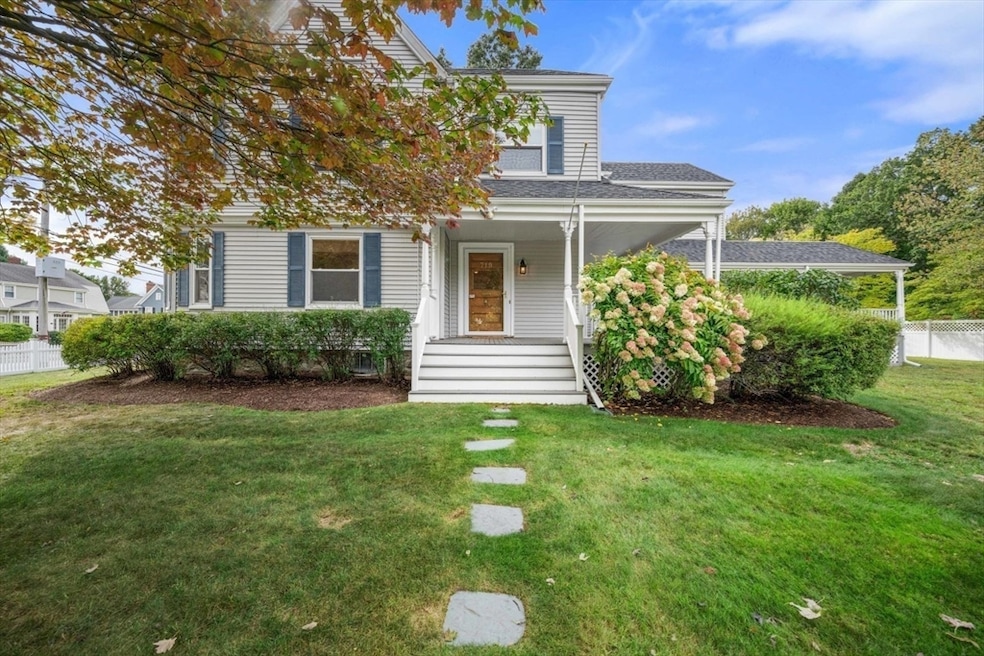
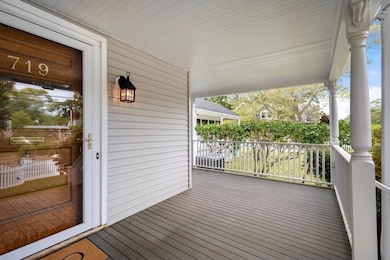
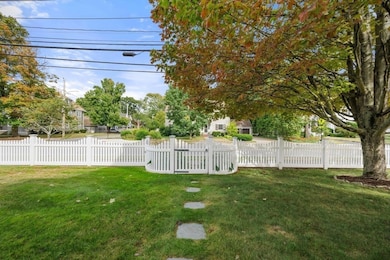
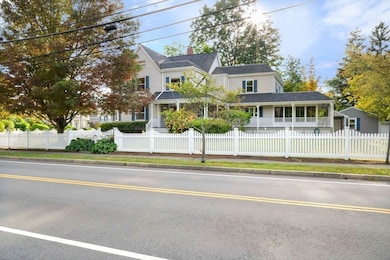
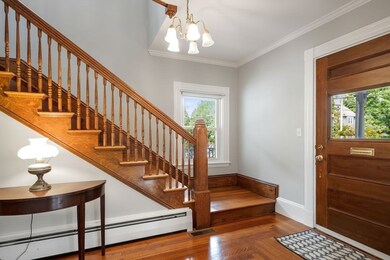
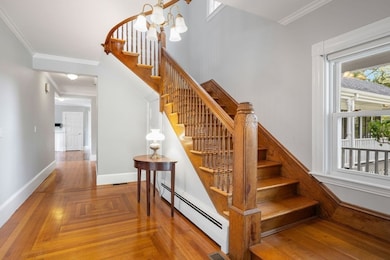
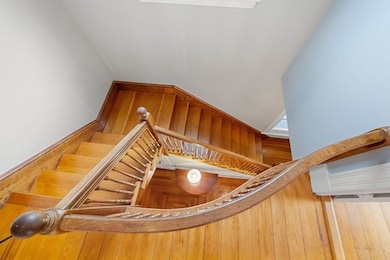
Perfectly positioned in the heart of Needham Center, along the cherished July 4th Parade route, this distinguished Victorian seamlessly blends historic character with modern convenience. Once home to the Red Cross, the property showcases exquisite period details including turrets, intricate gumwood moldings, high ceilings, & hardwood floors. A grand foyer sets the tone for the home’s gracious interior, designed with both entertaining and everyday living in mind. The expansive family room opens to a large kitchen, leading out to a spacious screened-in porch and a wraparound deck, which invites indoor-outdoor living. 6 bedrooms, 3.5 baths & multiple living spaces, the home offers exceptional versatility. Additional highlights include an elevator to 3 floors, a rear staircase, a walk-up attic, & basement for future expansion. Central air 2016, roof 2018, 2-car oversized garage. A rare offering in Needham Center—steeped in history, filled with character, and ready for its next chapter.
Last Agent to Sell the Property
William Raveis R.E. & Home Services Listed on: 09/10/2025
| Date | Type | Sale Price | Title Company |
|---|---|---|---|
| Quit Claim Deed | $1,700,000 | -- | |
| Deed | $461,500 | -- | |
| Deed | $195,000 | -- | |
| Deed | $195,000 | -- |
| Date | Status | Loan Amount | Loan Type |
|---|---|---|---|
| Open | $700,000 | New Conventional | |
| Previous Owner | $460,000 | No Value Available | |
| Previous Owner | $537,000 | No Value Available |
| Date | Event | Price | List to Sale | Price per Sq Ft |
|---|---|---|---|---|
| 11/06/2025 11/06/25 | Sold | $1,700,000 | +9.7% | $425 / Sq Ft |
| 09/16/2025 09/16/25 | Pending | -- | -- | -- |
| 09/10/2025 09/10/25 | For Sale | $1,550,000 | -- | $387 / Sq Ft |
| Year | Tax Paid | Tax Assessment Tax Assessment Total Assessment is a certain percentage of the fair market value that is determined by local assessors to be the total taxable value of land and additions on the property. | Land | Improvement |
|---|---|---|---|---|
| 2025 | $19,382 | $1,828,500 | $1,013,100 | $815,400 |
| 2024 | $15,350 | $1,226,000 | $654,400 | $571,600 |
| 2023 | $15,454 | $1,185,100 | $654,400 | $530,700 |
| 2022 | $14,875 | $1,112,600 | $601,200 | $511,400 |
| 2021 | $14,497 | $1,112,600 | $601,200 | $511,400 |
| 2020 | $13,512 | $1,081,800 | $601,200 | $480,600 |
| 2019 | $12,609 | $1,017,700 | $547,400 | $470,300 |
| 2018 | $12,090 | $1,017,700 | $547,400 | $470,300 |
| 2017 | $11,305 | $950,800 | $547,400 | $403,400 |
| 2016 | $10,972 | $950,800 | $547,400 | $403,400 |
| 2015 | $10,735 | $950,800 | $547,400 | $403,400 |
| 2014 | $10,218 | $877,800 | $494,700 | $383,100 |
Seller's Agent in 2025
Amy Gworek
William Raveis R.E. & Home Services
(617) 571-2390
22 in this area
44 Total Sales
Buyer's Agent in 2025
Lee Tran
William Raveis R.E. & Home Services
(781) 856-7191
2 in this area
10 Total Sales
Source: MLS Property Information Network (MLS PIN)
MLS Number: 73428622
APN: NEED-000049-000063
Disclaimer: Certain information contained herein is derived from information provided by parties other than Homes.com. All information provided is deemed reliable, but is not guaranteed to be accurate and should be independently verified.
![]() The property listing data and information, or the Images, set forth herein were provided to MLS Property Information Network, Inc. from third party sources, including sellers, lessors and public records, and were compiled by MLS Property Information Network, Inc. The property listing data and information, and the Images, are for the personal, non-commercial use of consumers having a good faith interest in purchasing or leasing listed properties of the type displayed to them and may not be used for any purpose other than to identify prospective properties which such consumers may have a good faith interest in purchasing or leasing. MLS Property Information Network, Inc. and its subscribers disclaim any and all representations and warranties as to the accuracy of the property listing data and information, or as to the accuracy of any of the Images, set forth herein.
The property listing data and information, or the Images, set forth herein were provided to MLS Property Information Network, Inc. from third party sources, including sellers, lessors and public records, and were compiled by MLS Property Information Network, Inc. The property listing data and information, and the Images, are for the personal, non-commercial use of consumers having a good faith interest in purchasing or leasing listed properties of the type displayed to them and may not be used for any purpose other than to identify prospective properties which such consumers may have a good faith interest in purchasing or leasing. MLS Property Information Network, Inc. and its subscribers disclaim any and all representations and warranties as to the accuracy of the property listing data and information, or as to the accuracy of any of the Images, set forth herein.
Ask me questions while you tour the home.