719 Windward Ln Unit 10719 Columbus, OH 43230
Estimated Value: $314,000 - $344,000
2
Beds
2
Baths
1,500
Sq Ft
$217/Sq Ft
Est. Value
About This Home
This home is located at 719 Windward Ln Unit 10719, Columbus, OH 43230 and is currently estimated at $325,124, approximately $216 per square foot. 719 Windward Ln Unit 10719 is a home located in Franklin County with nearby schools including High Point Elementary School, Gahanna East Middle School, and Lincoln High School.
Ownership History
Date
Name
Owned For
Owner Type
Purchase Details
Closed on
Apr 18, 2024
Sold by
Burgoon Jean L
Bought by
Jean L Burgoon Family Trust and Burgoon
Current Estimated Value
Purchase Details
Closed on
Jul 15, 2021
Sold by
Charon L Bauman Living Trust
Bought by
Burgoon Jean L and Burgoon Beeman E
Home Financials for this Owner
Home Financials are based on the most recent Mortgage that was taken out on this home.
Original Mortgage
$128,000
Interest Rate
2.9%
Mortgage Type
New Conventional
Purchase Details
Closed on
Nov 14, 2000
Sold by
Bauman Charon L
Bought by
Bauman Charon L and Charon L Bauman Living Trust
Purchase Details
Closed on
Jan 27, 1999
Sold by
The Epcon Group Inc
Bought by
Bauman Charon L
Home Financials for this Owner
Home Financials are based on the most recent Mortgage that was taken out on this home.
Original Mortgage
$113,520
Interest Rate
6.81%
Mortgage Type
Purchase Money Mortgage
Create a Home Valuation Report for This Property
The Home Valuation Report is an in-depth analysis detailing your home's value as well as a comparison with similar homes in the area
Home Values in the Area
Average Home Value in this Area
Purchase History
| Date | Buyer | Sale Price | Title Company |
|---|---|---|---|
| Jean L Burgoon Family Trust | -- | None Listed On Document | |
| Burgoon Jean L | $96,000 | New Title Company Name | |
| Bauman Charon L | -- | None Available | |
| Bauman Charon L | -- | -- | |
| Bauman Charon L | $141,900 | Chicago Title |
Source: Public Records
Mortgage History
| Date | Status | Borrower | Loan Amount |
|---|---|---|---|
| Previous Owner | Burgoon Jean L | $128,000 | |
| Previous Owner | Bauman Charon L | $113,520 |
Source: Public Records
Tax History Compared to Growth
Tax History
| Year | Tax Paid | Tax Assessment Tax Assessment Total Assessment is a certain percentage of the fair market value that is determined by local assessors to be the total taxable value of land and additions on the property. | Land | Improvement |
|---|---|---|---|---|
| 2024 | $5,685 | $96,500 | $28,000 | $68,500 |
| 2023 | $5,614 | $96,495 | $28,000 | $68,495 |
| 2022 | $5,327 | $71,330 | $10,920 | $60,410 |
| 2021 | $4,520 | $71,330 | $10,920 | $60,410 |
| 2020 | $4,482 | $71,330 | $10,920 | $60,410 |
| 2019 | $3,311 | $54,880 | $8,400 | $46,480 |
| 2018 | $2,810 | $54,880 | $8,400 | $46,480 |
| 2017 | $3,039 | $54,880 | $8,400 | $46,480 |
| 2016 | $2,332 | $40,990 | $6,970 | $34,020 |
| 2015 | $2,334 | $40,990 | $6,970 | $34,020 |
| 2014 | $2,316 | $40,990 | $6,970 | $34,020 |
| 2013 | $1,312 | $45,535 | $7,735 | $37,800 |
Source: Public Records
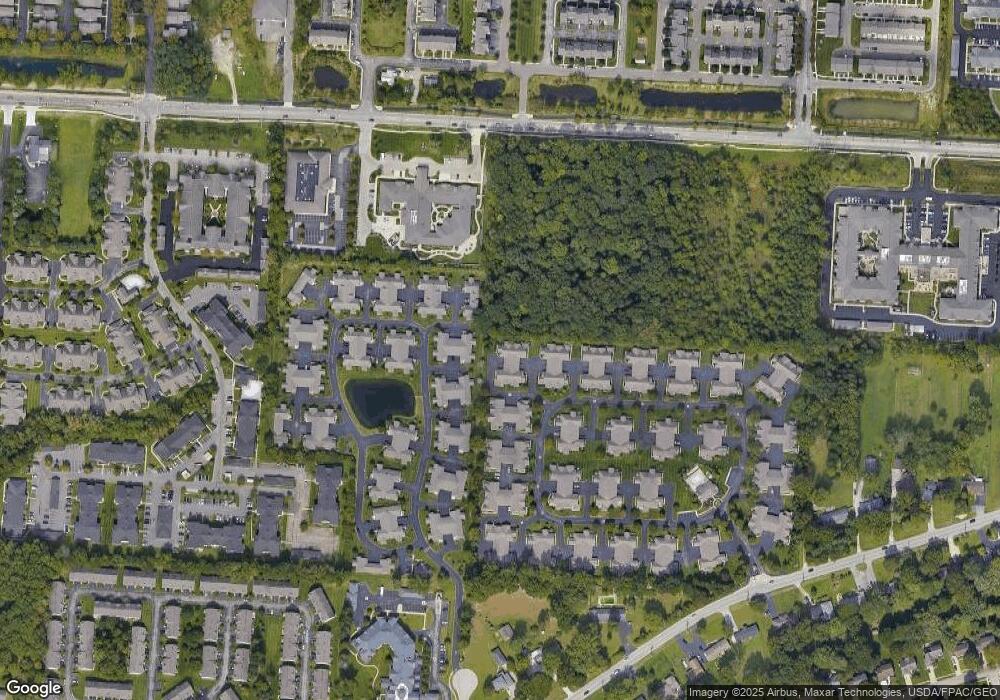
Map
Nearby Homes
- 4651 E Johnstown Rd
- 6263 Wagtail Rd Unit 13
- 597 Piney Glen Dr Unit 597
- 1199 Riva Ridge Blvd
- 6200 Downwing Ln Unit 20
- 636 Grove Cir Unit 1803
- 6169 Needletail Rd
- 3753 Brightwell Ln
- 3826 Wood Stork Ln Unit 68
- 6019 Bentgate Ln Unit 60192
- 6232 Joes Hopper Rd Unit 52
- 4705 Wenham Park Unit 15B
- 4574 N Hamilton Rd
- 4636 Collingville Way Unit 22
- 777 Dark Star Ave
- 1035 Riva Ridge Blvd
- 4135 Pathfield Dr
- 4062 Summerstone Dr
- 0 Beecher Crossing
- 4220 E Johnstown Rd
- 725 Windward Ln Unit 10725
- 721 Windward Ln Unit 10721
- 723 Windward Ln Unit 10723
- 1296 Amberlea Dr E
- 1292 Amberlea Dr E
- 1318 Amberlea Dr E
- 727 Windward Ln Unit 9727
- 729 Windward Ln Unit 9729
- 1276 Amberlea Dr E
- 728 Windward Ln
- 1298 Amberlea Dr E
- 1294 Amberlea Dr E
- 1272 Amberlea Dr E
- 734 Windward Way
- 734 Windward Way Unit 11-7
- 734 Windward Way Unit 11-734
- 731 Windward Ln Unit 9731
- 1320 Amberlea Dr E
- 733 Windward Ln Unit 9733
- 1278 Amberlea Dr E