Estimated Value: $339,000 - $428,000
3
Beds
2
Baths
1,749
Sq Ft
$222/Sq Ft
Est. Value
About This Home
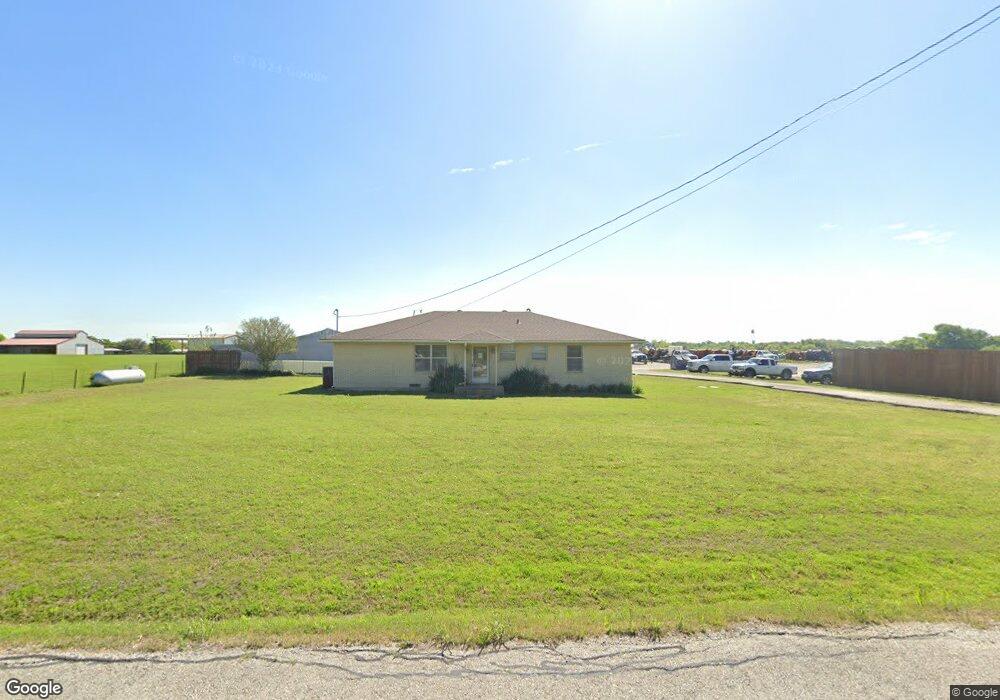
This home is located at 7193 Gregg Rd, Krum, TX 76249 and is currently estimated at $387,806, approximately $221 per square foot. 7193 Gregg Rd is a home located in Denton County with nearby schools including Krum Early Education Center, Dyer Elementary School, and Krum Middle School.
Ownership History
Date
Name
Owned For
Owner Type
Purchase Details
Closed on
Jun 24, 2011
Sold by
Schleker Denise
Bought by
Schleker Denise
Current Estimated Value
Purchase Details
Closed on
Dec 23, 2009
Sold by
Graham Jerry and Graham Donna
Bought by
Schleker Craig and Schleker Denise
Home Financials for this Owner
Home Financials are based on the most recent Mortgage that was taken out on this home.
Original Mortgage
$112,500
Interest Rate
4.82%
Mortgage Type
New Conventional
Create a Home Valuation Report for This Property
The Home Valuation Report is an in-depth analysis detailing your home's value as well as a comparison with similar homes in the area
Home Values in the Area
Average Home Value in this Area
Purchase History
| Date | Buyer | Sale Price | Title Company |
|---|---|---|---|
| Schleker Denise | -- | None Available | |
| Schleker Craig | -- | Stnt |
Source: Public Records
Mortgage History
| Date | Status | Borrower | Loan Amount |
|---|---|---|---|
| Closed | Schleker Craig | $112,500 |
Source: Public Records
Tax History
| Year | Tax Paid | Tax Assessment Tax Assessment Total Assessment is a certain percentage of the fair market value that is determined by local assessors to be the total taxable value of land and additions on the property. | Land | Improvement |
|---|---|---|---|---|
| 2025 | $3,961 | $292,000 | $239,951 | $52,049 |
| 2024 | $3,961 | $279,436 | $165,256 | $114,180 |
| 2023 | $3,327 | $271,283 | $165,256 | $106,027 |
| 2022 | $2,916 | $178,366 | $72,742 | $105,624 |
| 2021 | $2,440 | $155,396 | $62,074 | $93,322 |
| 2020 | $2,759 | $170,586 | $62,074 | $108,512 |
| 2019 | $2,648 | $150,000 | $62,074 | $87,926 |
| 2018 | $2,621 | $147,448 | $62,074 | $85,374 |
| 2017 | $2,593 | $144,994 | $62,074 | $82,920 |
| 2016 | $9,962 | $146,623 | $62,074 | $84,549 |
| 2015 | -- | $149,000 | $62,074 | $86,926 |
| 2013 | -- | $145,545 | $62,074 | $83,471 |
Source: Public Records
Map
Nearby Homes
Your Personal Tour Guide
Ask me questions while you tour the home.