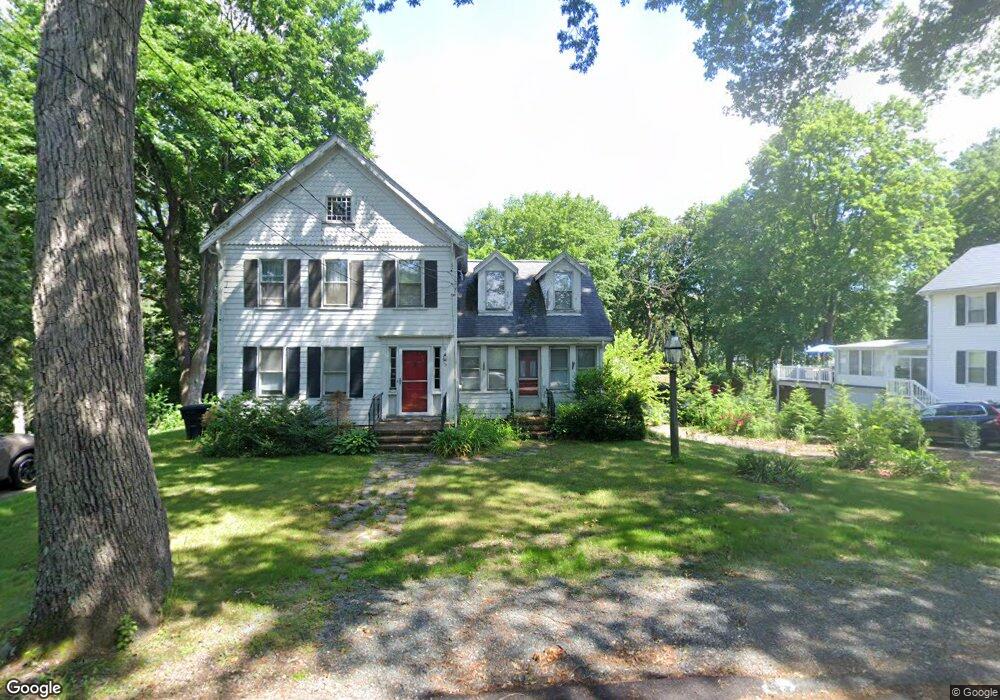
72 Allen St Walpole, MA 02081
Estimated Value: $706,000 - $757,000
3
Beds
2
Baths
1,885
Sq Ft
$387/Sq Ft
Est. Value
About This Home
This home is located at 72 Allen St, Walpole, MA 02081 and is currently estimated at $729,399, approximately $386 per square foot. 72 Allen St is a home located in Norfolk County with nearby schools including Elm Street School, Eleanor N. Johnson Middle School, and Walpole High School.
Ownership History
Date
Name
Owned For
Owner Type
Purchase Details
Closed on
Dec 1, 1995
Sold by
Est Jefferson Laurie H and Jefferson James L
Bought by
Jefferson Kenneth J
Current Estimated Value
Home Financials for this Owner
Home Financials are based on the most recent Mortgage that was taken out on this home.
Original Mortgage
$150,600
Interest Rate
7.37%
Mortgage Type
Purchase Money Mortgage
Create a Home Valuation Report for This Property
The Home Valuation Report is an in-depth analysis detailing your home's value as well as a comparison with similar homes in the area
Home Values in the Area
Average Home Value in this Area
Purchase History
| Date | Buyer | Sale Price | Title Company |
|---|---|---|---|
| Jefferson Kenneth J | $150,600 | -- |
Source: Public Records
Mortgage History
| Date | Status | Borrower | Loan Amount |
|---|---|---|---|
| Open | Jefferson Kenneth J | $125,000 | |
| Closed | Jefferson Kenneth J | $120,000 | |
| Closed | Jefferson Kenneth J | $150,600 |
Source: Public Records
Tax History Compared to Growth
Tax History
| Year | Tax Paid | Tax Assessment Tax Assessment Total Assessment is a certain percentage of the fair market value that is determined by local assessors to be the total taxable value of land and additions on the property. | Land | Improvement |
|---|---|---|---|---|
| 2025 | $7,903 | $616,000 | $303,600 | $312,400 |
| 2024 | $7,665 | $579,800 | $292,000 | $287,800 |
| 2023 | $7,384 | $531,600 | $253,800 | $277,800 |
| 2022 | $6,936 | $479,700 | $234,900 | $244,800 |
| 2021 | $6,587 | $443,900 | $221,600 | $222,300 |
| 2020 | $6,504 | $433,900 | $209,000 | $224,900 |
| 2019 | $6,206 | $411,000 | $201,000 | $210,000 |
| 2018 | $5,934 | $388,600 | $193,300 | $195,300 |
| 2017 | $5,736 | $374,200 | $185,900 | $188,300 |
| 2016 | $5,420 | $348,300 | $180,700 | $167,600 |
| 2015 | $5,216 | $332,200 | $172,300 | $159,900 |
| 2014 | $5,031 | $319,200 | $172,300 | $146,900 |
Source: Public Records
Map
Nearby Homes
- 18 Teal Cir
- 8 Autumn Ln
- 24 Pelican Dr
- 66 Oak St
- 127 Clear Pond Dr
- 137 Clear Pond Dr
- 1391 Main St Unit 304
- 1391 Main St Unit 208
- 1391 Main St Unit 305
- 1391 Main St Unit 308
- 16 Magpie Cir Unit 16
- 145 South St Unit 5
- 145 South St Unit 19
- 31 Sandtrap Cir Unit 5
- 10 Sandtrap Cir Unit 2
- 13 Sandtrap Cir Unit 14
- 11 Sandtrap Cir Unit 15
- 20 Sandtrap Cir Unit 4
- 18 Sandtrap Cir Unit 3
- 17 Sandtrap Cir Unit 12
- 70 Allen St
- 195 Spring St
- 195 Spring St Unit 1
- 76 Allen St Unit 78
- 76 Allen St Unit 1
- 215 Spring St
- 60 Allen St
- 191 Spring St
- 199 Spring St
- 84 Allen St
- 181 Spring St
- 35 Merganser Way
- 225 Spring St
- 32 Merganser Way
- 32 Merganser Way Unit 32
- 34 Merganser Way
- 50 Allen St
- 86 Allen St
- 171 Spring St
- 31 Merganser Way