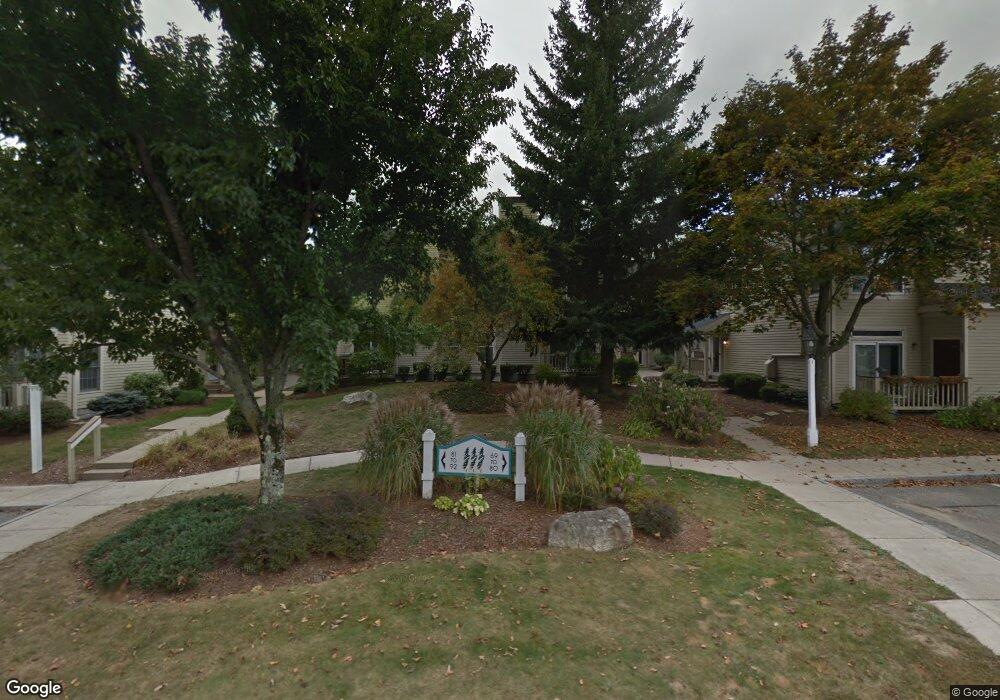
72 Bradford Commons Ln Braintree, MA 02184
South Braintree NeighborhoodEstimated Value: $390,940 - $550,000
2
Beds
2
Baths
871
Sq Ft
$508/Sq Ft
Est. Value
About This Home
This home is located at 72 Bradford Commons Ln, Braintree, MA 02184 and is currently estimated at $442,235, approximately $507 per square foot. 72 Bradford Commons Ln is a home located in Norfolk County with nearby schools including Braintree High School, First Baptist Christian School, and Boston Higashi School.
Ownership History
Date
Name
Owned For
Owner Type
Purchase Details
Closed on
Mar 12, 2018
Sold by
Finneran Kathleen M
Bought by
Kathleen M Finneran Re
Current Estimated Value
Purchase Details
Closed on
Aug 13, 1999
Sold by
Caldwell Donna M
Bought by
Finneran Kathleen M
Home Financials for this Owner
Home Financials are based on the most recent Mortgage that was taken out on this home.
Original Mortgage
$125,500
Interest Rate
7.65%
Mortgage Type
Purchase Money Mortgage
Purchase Details
Closed on
Jul 29, 1997
Sold by
Clarke Anne C
Bought by
Caldwell Donna M
Home Financials for this Owner
Home Financials are based on the most recent Mortgage that was taken out on this home.
Original Mortgage
$45,000
Interest Rate
7.41%
Purchase Details
Closed on
Sep 15, 1994
Sold by
Scarnici Paul and Scarnici Elaine M
Bought by
Clarke Anne C
Home Financials for this Owner
Home Financials are based on the most recent Mortgage that was taken out on this home.
Original Mortgage
$85,000
Interest Rate
8.38%
Mortgage Type
Purchase Money Mortgage
Create a Home Valuation Report for This Property
The Home Valuation Report is an in-depth analysis detailing your home's value as well as a comparison with similar homes in the area
Home Values in the Area
Average Home Value in this Area
Purchase History
| Date | Buyer | Sale Price | Title Company |
|---|---|---|---|
| Kathleen M Finneran Re | -- | -- | |
| Finneran Kathleen M | $165,500 | -- | |
| Caldwell Donna M | $130,000 | -- | |
| Clarke Anne C | $123,100 | -- |
Source: Public Records
Mortgage History
| Date | Status | Borrower | Loan Amount |
|---|---|---|---|
| Previous Owner | Clarke Anne C | $114,800 | |
| Previous Owner | Clarke Anne C | $125,500 | |
| Previous Owner | Clarke Anne C | $45,000 | |
| Previous Owner | Clarke Anne C | $85,000 |
Source: Public Records
Tax History Compared to Growth
Tax History
| Year | Tax Paid | Tax Assessment Tax Assessment Total Assessment is a certain percentage of the fair market value that is determined by local assessors to be the total taxable value of land and additions on the property. | Land | Improvement |
|---|---|---|---|---|
| 2025 | $4,207 | $421,500 | $0 | $421,500 |
| 2024 | $3,771 | $397,800 | $0 | $397,800 |
| 2023 | $3,380 | $346,300 | $0 | $346,300 |
| 2022 | $3,222 | $323,800 | $0 | $323,800 |
| 2021 | $3,143 | $315,900 | $0 | $315,900 |
| 2020 | $2,897 | $293,800 | $0 | $293,800 |
| 2019 | $2,861 | $283,500 | $0 | $283,500 |
| 2018 | $2,771 | $262,900 | $0 | $262,900 |
| 2017 | $2,732 | $254,400 | $0 | $254,400 |
| 2016 | $2,670 | $243,200 | $0 | $243,200 |
| 2015 | $2,605 | $235,300 | $0 | $235,300 |
| 2014 | $2,564 | $224,500 | $0 | $224,500 |
Source: Public Records
Map
Nearby Homes
- 134 Tyson Commons Ln
- 30 Bradford Commons Ln
- 68 Massapoag St Unit 7
- 1501 Liberty St
- 308 Forest St
- 16 Jay Rd
- 211 Randolph St
- 24 Fisher Rd
- 193 Randolph St
- 30 Thetford Ave
- 441 Grove St
- 432 Grove St
- 972 Liberty St
- 92 Mercury St
- 22 Medallion Rd
- 117 Amherst Rd
- 256 Evergreen Ave
- 115 Richard Rd
- 262 West St
- 255 West St
- 92 Bradford Commons Ln
- 91 Bradford Commons Ln
- 90 Bradford Commons Ln
- 89 Bradford Commons Ln
- 87 Bradford Commons Ln
- 85 Bradford Commons Ln
- 84 Bradford Commons Ln
- 83 Bradford Commons Ln
- 82 Bradford Commons Ln
- 81 Bradford Commons Ln
- 80 Bradford Commons Ln
- 79 Bradford Commons Ln
- 78 Bradford Commons Ln
- 77 Bradford Commons Ln
- 76 Bradford Commons Ln
- 75 Bradford Commons Ln
- 74 Bradford Commons Ln
- 73 Bradford Commons Ln
- 71 Bradford Commons Ln
- 70 Bradford Commons Ln