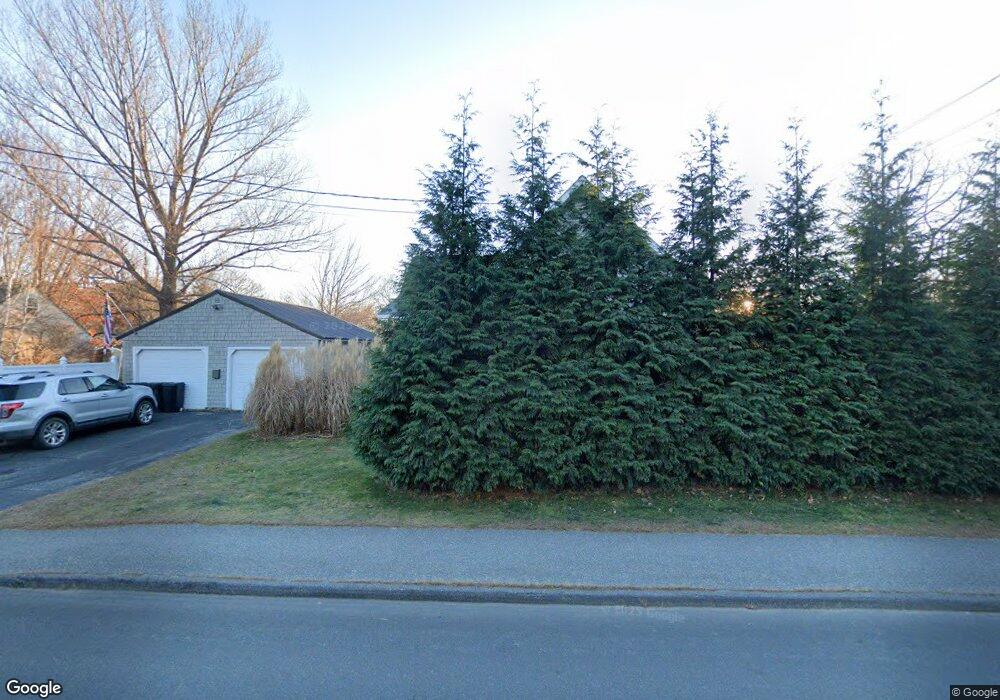
72 Bridge St Topsham, ME 04086
Estimated Value: $466,000 - $536,000
2
Beds
1
Bath
1,552
Sq Ft
$319/Sq Ft
Est. Value
About This Home
This home is located at 72 Bridge St, Topsham, ME 04086 and is currently estimated at $494,670, approximately $318 per square foot. 72 Bridge St is a home located in Sagadahoc County with nearby schools including Mt Ararat High School, Harpswell Coastal Academy Divisions 2 and 3, and St. John's Catholic School.
Ownership History
Date
Name
Owned For
Owner Type
Purchase Details
Closed on
Dec 16, 2005
Sold by
Vadeboncoeur Michelle M
Bought by
Biedrzycki Keith
Current Estimated Value
Home Financials for this Owner
Home Financials are based on the most recent Mortgage that was taken out on this home.
Original Mortgage
$114,000
Interest Rate
9%
Mortgage Type
Adjustable Rate Mortgage/ARM
Create a Home Valuation Report for This Property
The Home Valuation Report is an in-depth analysis detailing your home's value as well as a comparison with similar homes in the area
Home Values in the Area
Average Home Value in this Area
Purchase History
| Date | Buyer | Sale Price | Title Company |
|---|---|---|---|
| Biedrzycki Keith | -- | -- |
Source: Public Records
Mortgage History
| Date | Status | Borrower | Loan Amount |
|---|---|---|---|
| Closed | Biedrzycki Keith | $114,000 |
Source: Public Records
Tax History Compared to Growth
Tax History
| Year | Tax Paid | Tax Assessment Tax Assessment Total Assessment is a certain percentage of the fair market value that is determined by local assessors to be the total taxable value of land and additions on the property. | Land | Improvement |
|---|---|---|---|---|
| 2024 | $5,398 | $431,800 | $80,300 | $351,500 |
| 2023 | $5,242 | $386,000 | $76,600 | $309,400 |
| 2022 | $4,571 | $317,000 | $71,000 | $246,000 |
| 2021 | $4,432 | $279,300 | $65,100 | $214,200 |
| 2020 | $4,508 | $252,400 | $65,100 | $187,300 |
| 2019 | $4,328 | $226,000 | $62,500 | $163,500 |
| 2018 | $4,019 | $214,600 | $48,900 | $165,700 |
| 2017 | $3,889 | $214,600 | $48,900 | $165,700 |
| 2016 | $3,799 | $211,200 | $48,900 | $162,300 |
| 2015 | $3,671 | $204,400 | $48,900 | $155,500 |
| 2014 | $3,424 | $197,600 | $48,900 | $148,700 |
| 2013 | $3,290 | $197,600 | $48,900 | $148,700 |
Source: Public Records
Map
Nearby Homes
- 29 Winter St
- 57 Winter St
- 44 Forest Glen Ln
- 28 Forest Glen Ln
- 4 Wilson St
- 43 Forest Glen Ln
- 17 Middle St
- 22 Oak St Unit 2
- 22 Oak St Unit 1
- 19 Mason St
- 118 Main St
- 23 Forest Glen Ln
- 67 Forest Glen Ln
- 14 Patricia Dr
- 22 Cedar St
- 86 Merrymeeting Rd
- 87 River Rd
- 26 Union Park Rd
- 132 Pleasant St
- 3 Nugget Ln Unit 3