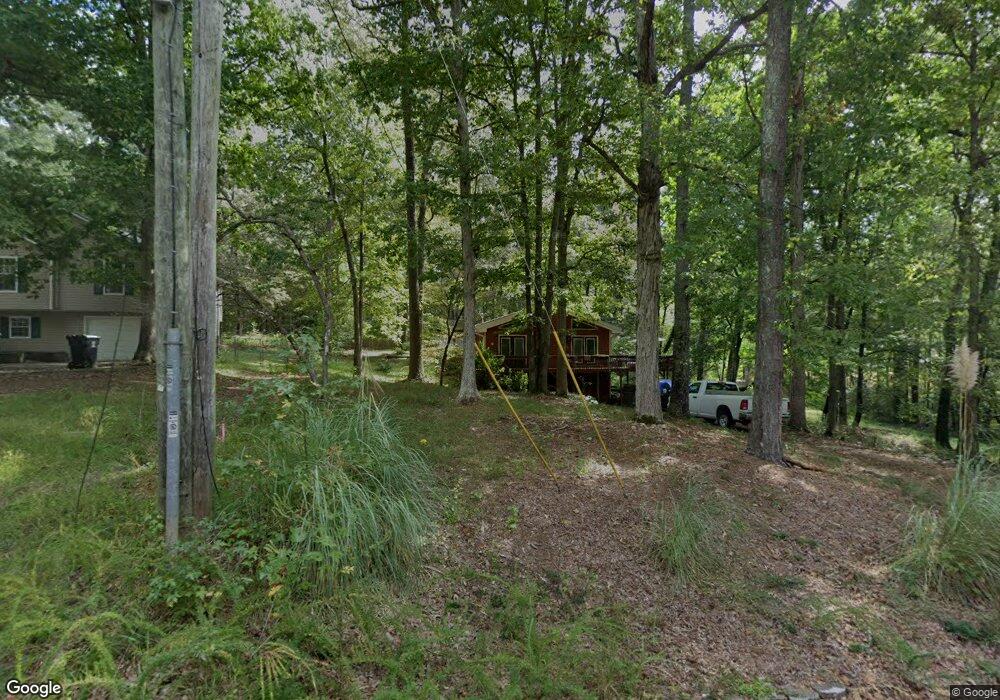
72 Brock Ln Unit 18 Carrollton, GA 30117
Estimated Value: $258,000 - $292,000
3
Beds
2
Baths
1,450
Sq Ft
$186/Sq Ft
Est. Value
About This Home
This home is located at 72 Brock Ln Unit 18, Carrollton, GA 30117 and is currently estimated at $270,390, approximately $186 per square foot. 72 Brock Ln Unit 18 is a home located in Carroll County with nearby schools including Mt. Zion Elementary School, Mt. Zion Middle School, and Mt. Zion High School.
Ownership History
Date
Name
Owned For
Owner Type
Purchase Details
Closed on
Feb 16, 2016
Sold by
3845 Willowbrook Llc
Bought by
Jackson Paul David and Jackson Frances L
Current Estimated Value
Home Financials for this Owner
Home Financials are based on the most recent Mortgage that was taken out on this home.
Original Mortgage
$82,875
Outstanding Balance
$50,897
Interest Rate
3.81%
Mortgage Type
New Conventional
Estimated Equity
$219,493
Purchase Details
Closed on
Nov 5, 2015
Sold by
Lutes Eugenia P
Bought by
3845 Willowbrook Llc
Purchase Details
Closed on
Sep 7, 2012
Sold by
Goldman Sachs Mtg Co
Bought by
Lutes Arthur and Lutes Eugenia
Purchase Details
Closed on
Jun 5, 2012
Sold by
Meixner Michael F
Bought by
Goldman Sachs Mtg Co
Purchase Details
Closed on
Jan 28, 2004
Sold by
Meixner Michael F and Meixner Kimberly J
Bought by
Meixner Michael F
Purchase Details
Closed on
Dec 1, 1986
Bought by
Meixner
Create a Home Valuation Report for This Property
The Home Valuation Report is an in-depth analysis detailing your home's value as well as a comparison with similar homes in the area
Home Values in the Area
Average Home Value in this Area
Purchase History
| Date | Buyer | Sale Price | Title Company |
|---|---|---|---|
| Jackson Paul David | $110,500 | -- | |
| 3845 Willowbrook Llc | $53,000 | -- | |
| Lutes Arthur | $39,000 | -- | |
| Goldman Sachs Mtg Co | $38,500 | -- | |
| Meixner Michael F | -- | -- | |
| Meixner | -- | -- |
Source: Public Records
Mortgage History
| Date | Status | Borrower | Loan Amount |
|---|---|---|---|
| Open | Jackson Paul David | $82,875 |
Source: Public Records
Tax History Compared to Growth
Tax History
| Year | Tax Paid | Tax Assessment Tax Assessment Total Assessment is a certain percentage of the fair market value that is determined by local assessors to be the total taxable value of land and additions on the property. | Land | Improvement |
|---|---|---|---|---|
| 2024 | $1,013 | $87,738 | $4,000 | $83,738 |
| 2023 | $1,013 | $80,667 | $4,000 | $76,667 |
| 2022 | $2,058 | $64,047 | $4,000 | $60,047 |
| 2021 | $1,836 | $56,154 | $4,000 | $52,154 |
| 2020 | $1,282 | $49,932 | $4,000 | $45,932 |
| 2019 | $1,211 | $46,795 | $4,000 | $42,795 |
| 2018 | $1,106 | $42,112 | $4,000 | $38,112 |
| 2017 | $1,109 | $42,112 | $4,000 | $38,112 |
| 2016 | $559 | $42,112 | $4,000 | $38,112 |
| 2015 | $892 | $31,906 | $4,000 | $27,906 |
| 2014 | $896 | $31,906 | $4,000 | $27,906 |
Source: Public Records
Map
Nearby Homes
- 313 Lucy Ln
- 141 Anita Blvd
- 153 Anita Blvd
- 206 Randall Dr
- 898 Bowdon Junction Rd
- 142 Tyler Ln
- 68 Tyler Ln
- 174 Katie Ln
- The Thomas 2 Plan at Lambert Overlook
- The Thomas Plan at Lambert Overlook
- The Brook Plan at Lambert Overlook
- 266 Lambert Overlook Cir
- 46 Gammon Rd
- 10 Joshua Way
- 30 Joshua Way
- 33 Armstrong Dr
- 469 Lee Williams Rd
- 292 S Prospect Ave
- 436 S Prospect Ave
- 676 Hog Liver Rd