72 Carpenter St Pawtucket, RI 02860
Downtown Pawtucket NeighborhoodEstimated Value: $369,158 - $527,000
3
Beds
2
Baths
1,310
Sq Ft
$353/Sq Ft
Est. Value
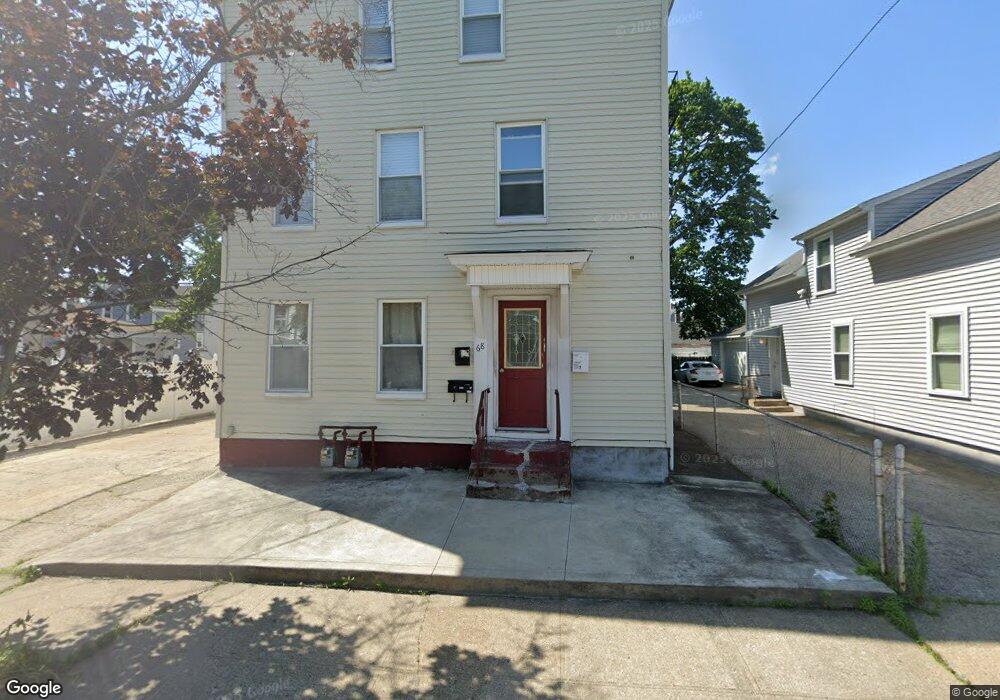
About This Home
This home is located at 72 Carpenter St, Pawtucket, RI 02860 and is currently estimated at $461,790, approximately $352 per square foot. 72 Carpenter St is a home located in Providence County with nearby schools including International Charter School, Blackstone Valley Prep Junior High School, and Blackstone Academy Charter School.
Ownership History
Date
Name
Owned For
Owner Type
Purchase Details
Closed on
Jan 22, 2019
Sold by
Mrp Investments Llc
Bought by
Pereira Matthew R
Current Estimated Value
Purchase Details
Closed on
May 3, 2016
Sold by
Pereira Rui A
Bought by
Mrp Investments Llc
Home Financials for this Owner
Home Financials are based on the most recent Mortgage that was taken out on this home.
Original Mortgage
$100,000
Interest Rate
3.73%
Mortgage Type
Purchase Money Mortgage
Purchase Details
Closed on
Sep 27, 2013
Sold by
Mello Christopher F
Bought by
Pereira Rui A and Pereira Anna C
Create a Home Valuation Report for This Property
The Home Valuation Report is an in-depth analysis detailing your home's value as well as a comparison with similar homes in the area
Home Values in the Area
Average Home Value in this Area
Purchase History
| Date | Buyer | Sale Price | Title Company |
|---|---|---|---|
| Pereira Matthew R | -- | -- | |
| Mrp Investments Llc | $100,000 | -- | |
| Pereira Rui A | $18,000 | -- |
Source: Public Records
Mortgage History
| Date | Status | Borrower | Loan Amount |
|---|---|---|---|
| Previous Owner | Mrp Investments Llc | $100,000 |
Source: Public Records
Tax History
| Year | Tax Paid | Tax Assessment Tax Assessment Total Assessment is a certain percentage of the fair market value that is determined by local assessors to be the total taxable value of land and additions on the property. | Land | Improvement |
|---|---|---|---|---|
| 2025 | $4,414 | $335,700 | $118,300 | $217,400 |
| 2024 | $4,143 | $335,700 | $118,300 | $217,400 |
| 2023 | $3,601 | $212,600 | $53,200 | $159,400 |
| 2022 | $3,525 | $212,600 | $53,200 | $159,400 |
| 2021 | $3,525 | $212,600 | $53,200 | $159,400 |
| 2020 | $3,432 | $164,300 | $53,900 | $110,400 |
| 2019 | $3,432 | $164,300 | $53,900 | $110,400 |
| 2018 | $3,307 | $164,300 | $53,900 | $110,400 |
| 2017 | $2,945 | $129,600 | $41,000 | $88,600 |
| 2016 | $2,837 | $129,600 | $41,000 | $88,600 |
| 2015 | $2,837 | $129,600 | $41,000 | $88,600 |
| 2014 | $2,834 | $122,900 | $52,700 | $70,200 |
Source: Public Records
Map
Nearby Homes
- 17 Beecher St
- 27 Lloyd St
- 14 Martin Ct
- 48 Star St
- 193 Harrison St
- 546 Lonsdale Ave Unit 548
- 75 Larch St
- 75 Baldwin St
- 76 Slater St
- 616 Lonsdale Ave Unit 618
- 59 West Ave
- 140 Dexter St
- 57 Garden St
- 107 Mulberry St
- 45 Harrison St
- 28 Bayley St Unit 107
- 28 Bayley St Unit 301
- 35 Hurley Ave
- 584 Weeden St
- 0 Webb St Unit 1406927
- 78 Carpenter St
- 68 Carpenter St
- 68 Carpenter St Unit Carpenter
- 84 Carpenter St
- 303 Weeden St
- 62 Carpenter St
- 309 Weeden St
- 297 Weeden St
- 67 Carpenter St
- 73 Carpenter St
- 79 Carpenter St
- 311 Weeden St
- 88 Carpenter St
- 291 Weeden St
- 56 Carpenter St
- 85 Carpenter St
- 313 Weeden St
- 321 Weeden St
- 30 Sumner St
- 61 Carpenter St
Your Personal Tour Guide
Ask me questions while you tour the home.