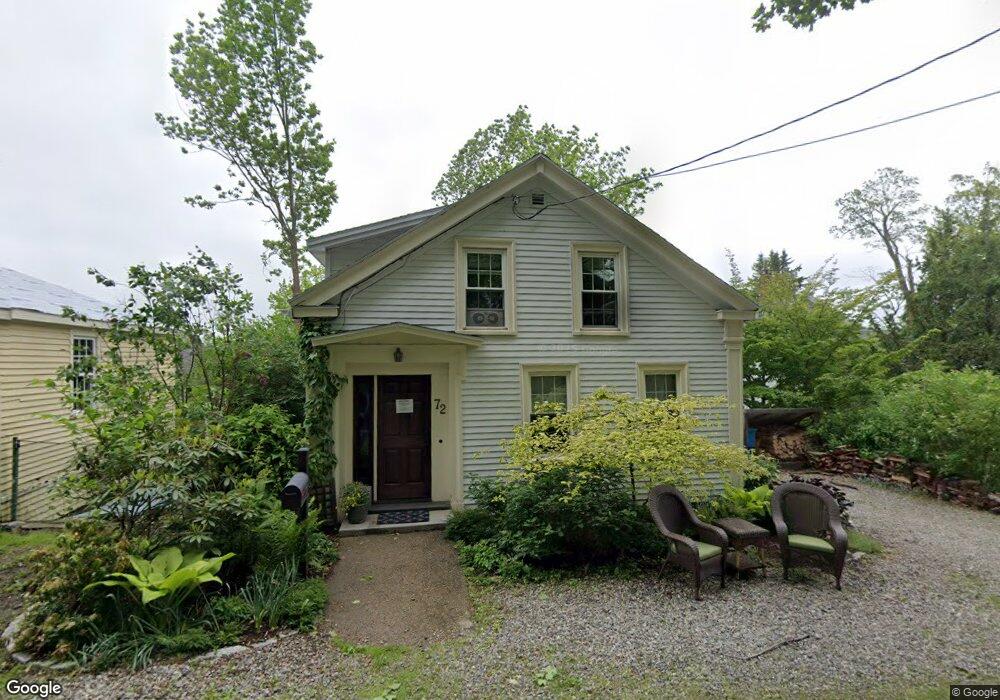
72 Charles St Belfast, ME 04915
Estimated Value: $477,913 - $629,000
4
Beds
3
Baths
2,300
Sq Ft
$231/Sq Ft
Est. Value
About This Home
This home is located at 72 Charles St, Belfast, ME 04915 and is currently estimated at $530,978, approximately $230 per square foot. 72 Charles St is a home located in Waldo County with nearby schools including Cornerspring Children's House and The School At Sweetser - Belfast.
Ownership History
Date
Name
Owned For
Owner Type
Purchase Details
Closed on
Jun 4, 2018
Sold by
Doherty Annie
Bought by
Kennedy Ann
Current Estimated Value
Purchase Details
Closed on
Jul 14, 2010
Sold by
Ryan Marcia J and Sawyer 3Rd Howard P
Bought by
Doherty Annie
Purchase Details
Closed on
Jul 1, 2009
Sold by
Shaw Janetta J Est
Bought by
Ryan Marcia and Sawyer Howard P
Home Financials for this Owner
Home Financials are based on the most recent Mortgage that was taken out on this home.
Original Mortgage
$160,000
Interest Rate
5%
Mortgage Type
Commercial
Create a Home Valuation Report for This Property
The Home Valuation Report is an in-depth analysis detailing your home's value as well as a comparison with similar homes in the area
Home Values in the Area
Average Home Value in this Area
Purchase History
| Date | Buyer | Sale Price | Title Company |
|---|---|---|---|
| Kennedy Ann | -- | -- | |
| Doherty Annie | -- | -- | |
| Ryan Marcia | -- | -- |
Source: Public Records
Mortgage History
| Date | Status | Borrower | Loan Amount |
|---|---|---|---|
| Previous Owner | Ryan Marcia | $160,000 |
Source: Public Records
Tax History Compared to Growth
Tax History
| Year | Tax Paid | Tax Assessment Tax Assessment Total Assessment is a certain percentage of the fair market value that is determined by local assessors to be the total taxable value of land and additions on the property. | Land | Improvement |
|---|---|---|---|---|
| 2024 | $5,490 | $356,500 | $63,900 | $292,600 |
| 2023 | $5,630 | $280,100 | $77,500 | $202,600 |
| 2022 | $5,789 | $270,500 | $77,500 | $193,000 |
| 2021 | $5,951 | $270,500 | $77,500 | $193,000 |
| 2020 | $5,608 | $240,700 | $69,700 | $171,000 |
| 2019 | $5,512 | $240,700 | $69,700 | $171,000 |
| 2018 | $4,497 | $198,100 | $69,700 | $128,400 |
| 2017 | $4,338 | $198,100 | $69,700 | $128,400 |
| 2016 | $3,611 | $157,700 | $21,300 | $136,400 |
| 2015 | $3,532 | $157,700 | $21,300 | $136,400 |
| 2014 | $3,414 | $157,700 | $21,300 | $136,400 |
| 2013 | $3,280 | $157,700 | $21,300 | $136,400 |
Source: Public Records
Map
Nearby Homes
- 38 Spring St
- 28 Charles St
- 68 Park St
- 208 High St
- Lot 5 School St
- Lot 6 School St
- 53 Lincolnville Ave
- Lot 3 Congress St
- 227 High St
- 38 Union St
- L3,4,5,6,7 Final Subd Plan Sanderson Subd
- Lots1,2,2A Elementary Ave
- 51 Bridge St
- Lot 7 Priscilla Ln
- 11 Durham St
- 17 Footbridge Rd
- 16 Cottage St
- 12 Ashley Dr
- 2 Swan Lake Ave
- 159 Waldo Ave