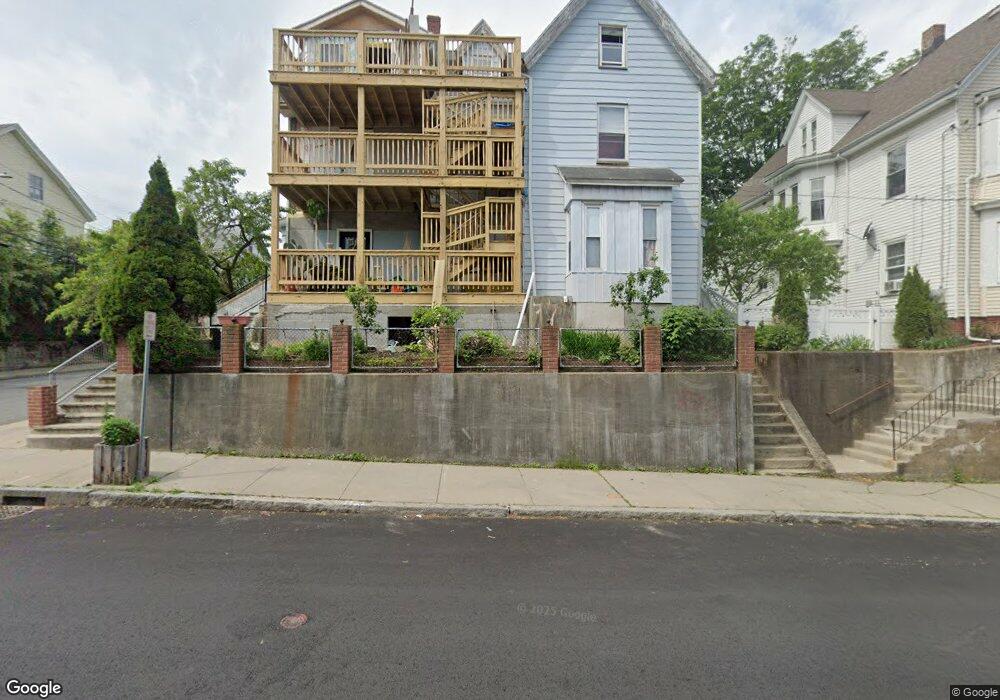
72 Chatham St Unit 74 Lynn, MA 01902
Diamond District NeighborhoodEstimated Value: $869,000 - $999,000
7
Beds
4
Baths
3,127
Sq Ft
$303/Sq Ft
Est. Value
About This Home
This home is located at 72 Chatham St Unit 74, Lynn, MA 01902 and is currently estimated at $946,000, approximately $302 per square foot. 72 Chatham St Unit 74 is a home located in Essex County with nearby schools including Brickett Elementary School, William R. Fallon School, and Marshall Middle School.
Ownership History
Date
Name
Owned For
Owner Type
Purchase Details
Closed on
Apr 19, 2001
Sold by
Ortega Angela
Bought by
Ramirez Carlos and Ramirez Martha
Current Estimated Value
Home Financials for this Owner
Home Financials are based on the most recent Mortgage that was taken out on this home.
Original Mortgage
$140,250
Outstanding Balance
$51,239
Interest Rate
6.9%
Mortgage Type
Purchase Money Mortgage
Estimated Equity
$894,761
Purchase Details
Closed on
Mar 31, 2000
Sold by
Santana Jesus A
Bought by
Ortega Angela
Home Financials for this Owner
Home Financials are based on the most recent Mortgage that was taken out on this home.
Original Mortgage
$127,680
Interest Rate
8.4%
Mortgage Type
Purchase Money Mortgage
Purchase Details
Closed on
Jul 31, 1998
Sold by
Kagil Realty Corp
Bought by
Santana Jesus A
Purchase Details
Closed on
Sep 27, 1995
Sold by
Lcb Ft and Cohen Lori
Bought by
Kagil Realty Corp
Create a Home Valuation Report for This Property
The Home Valuation Report is an in-depth analysis detailing your home's value as well as a comparison with similar homes in the area
Home Values in the Area
Average Home Value in this Area
Purchase History
| Date | Buyer | Sale Price | Title Company |
|---|---|---|---|
| Ramirez Carlos | $187,000 | -- | |
| Ramirez Carlos | $187,000 | -- | |
| Ortega Angela | $134,400 | -- | |
| Ortega Angela | $134,400 | -- | |
| Santana Jesus A | $99,000 | -- | |
| Santana Jesus A | $99,000 | -- | |
| Kagil Realty Corp | $38,000 | -- | |
| Kagil Realty Corp | $38,000 | -- |
Source: Public Records
Mortgage History
| Date | Status | Borrower | Loan Amount |
|---|---|---|---|
| Open | Kagil Realty Corp | $140,250 | |
| Closed | Kagil Realty Corp | $140,250 | |
| Previous Owner | Kagil Realty Corp | $127,680 |
Source: Public Records
Tax History Compared to Growth
Tax History
| Year | Tax Paid | Tax Assessment Tax Assessment Total Assessment is a certain percentage of the fair market value that is determined by local assessors to be the total taxable value of land and additions on the property. | Land | Improvement |
|---|---|---|---|---|
| 2025 | $8,005 | $772,700 | $169,300 | $603,400 |
| 2024 | $7,989 | $758,700 | $162,000 | $596,700 |
| 2023 | $7,871 | $705,900 | $173,200 | $532,700 |
| 2022 | $7,602 | $611,600 | $135,200 | $476,400 |
| 2021 | $7,095 | $544,500 | $110,800 | $433,700 |
| 2020 | $6,869 | $512,600 | $113,900 | $398,700 |
| 2019 | $6,421 | $449,000 | $88,000 | $361,000 |
| 2018 | $6,137 | $405,100 | $98,800 | $306,300 |
| 2017 | $5,795 | $371,500 | $86,800 | $284,700 |
| 2016 | $5,286 | $326,700 | $72,500 | $254,200 |
| 2015 | $4,921 | $293,800 | $76,700 | $217,100 |
Source: Public Records
Map
Nearby Homes
- 7 Sidney Ave
- 24 Parrott St
- 129 Williams Ave
- 26 Groveland St
- 46 Wardwell Ave
- 248 Essex St
- 175 Essex St
- 38 Chestnut St
- 38 Cherry St Unit 1
- 42 Basset St
- 35 Columbia Ave
- 2 Peirce Rd
- 14 Jewetts Ct
- 133 Eastern Ave Unit 8
- 59 Essex St Unit 59B
- 30 Clifton Ave
- 13 Portland St Unit 4
- 249 Chatham St
- 14-16 Dexter St
- 12 Chestnut Ave
- 72-74 Chatham St
- 5 Bloomfield St
- 76 Chatham St
- 7 Bloomfield St
- 80 Chatham St
- 80 Chatham St Unit 1
- 75 Chatham St
- 2 Bloomfield St
- 71 Chatham St
- 67 Chatham St
- 11 Bloomfield St
- 4 Bloomfield St
- 10 Bloomfield St
- 10 Bloomfield St Unit 1
- 7 Cypress Place
- 9 Cypress Place
- 64 Chatham St
- 8 Sanderson Ave
- 11 Sidney Ave
- 83 Chatham St Unit 85