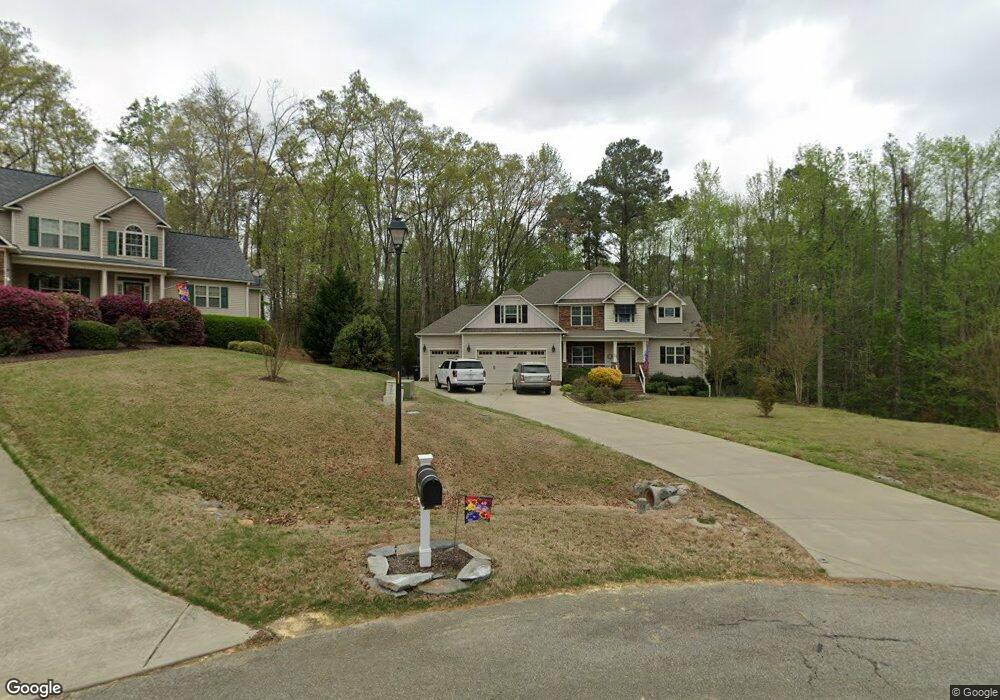
72 Cinnecord Place Unit 30 Garner, NC 27529
Cleveland NeighborhoodEstimated Value: $558,000 - $605,267
4
Beds
4
Baths
2,988
Sq Ft
$195/Sq Ft
Est. Value
About This Home
This home is located at 72 Cinnecord Place Unit 30, Garner, NC 27529 and is currently estimated at $584,067, approximately $195 per square foot. 72 Cinnecord Place Unit 30 is a home located in Johnston County with nearby schools including West View Elementary School, Cleveland Middle School, and West Johnston High School.
Ownership History
Date
Name
Owned For
Owner Type
Purchase Details
Closed on
Nov 4, 2024
Sold by
Riebel Robert R and Dame Ashley
Bought by
Miseirvitch Katrina Marie and Miseirvitch Alexander
Current Estimated Value
Home Financials for this Owner
Home Financials are based on the most recent Mortgage that was taken out on this home.
Original Mortgage
$472,120
Outstanding Balance
$467,385
Interest Rate
6.08%
Mortgage Type
New Conventional
Estimated Equity
$116,682
Purchase Details
Closed on
Sep 3, 2014
Sold by
Chronister Bobby Dean and Chronister Marian Kay
Bought by
Riebel Robert R and Riebel Vernita A
Purchase Details
Closed on
Nov 27, 2012
Sold by
Lanny K Clifton Builder Inc
Bought by
Chronister Bobby Dean and Chronister Marian Kay
Purchase Details
Closed on
Sep 8, 2011
Sold by
Son Lan Development Co Inc
Bought by
Atlas Nc Ii Spe Llc
Create a Home Valuation Report for This Property
The Home Valuation Report is an in-depth analysis detailing your home's value as well as a comparison with similar homes in the area
Home Values in the Area
Average Home Value in this Area
Purchase History
| Date | Buyer | Sale Price | Title Company |
|---|---|---|---|
| Miseirvitch Katrina Marie | $580,000 | None Listed On Document | |
| Riebel Robert R | $300,000 | None Available | |
| Chronister Bobby Dean | $287,500 | Chicago Title Insurance Co | |
| Atlas Nc Ii Spe Llc | $862,500 | None Available |
Source: Public Records
Mortgage History
| Date | Status | Borrower | Loan Amount |
|---|---|---|---|
| Open | Miseirvitch Katrina Marie | $472,120 |
Source: Public Records
Tax History Compared to Growth
Tax History
| Year | Tax Paid | Tax Assessment Tax Assessment Total Assessment is a certain percentage of the fair market value that is determined by local assessors to be the total taxable value of land and additions on the property. | Land | Improvement |
|---|---|---|---|---|
| 2025 | $3,654 | $575,360 | $90,000 | $485,360 |
| 2024 | $2,742 | $338,470 | $60,000 | $278,470 |
| 2023 | $2,657 | $338,470 | $60,000 | $278,470 |
| 2022 | $2,742 | $338,470 | $60,000 | $278,470 |
| 2021 | $2,742 | $338,470 | $60,000 | $278,470 |
| 2020 | $2,843 | $338,470 | $60,000 | $278,470 |
| 2019 | $2,775 | $338,470 | $60,000 | $278,470 |
| 2018 | $0 | $296,530 | $45,000 | $251,530 |
| 2017 | $2,491 | $296,530 | $45,000 | $251,530 |
| 2016 | $2,491 | $296,530 | $45,000 | $251,530 |
| 2014 | -- | $296,530 | $45,000 | $251,530 |
Source: Public Records
Map
Nearby Homes
- 50 Linden Ct
- 181 Fawn Hill Ct
- 48 Banbury Ct
- 75 Fawn Hill Ct
- 1095 Fieldtrial Cir
- 648 Fieldtrial Cir
- Fontana Plan at Brant Station
- Avenel II Plan at Brant Station
- 413 Fieldtrial Cir
- 111 Artic Cir
- 291 Artic Cir
- 368 Artic Cir
- 212 Fox Pen Dr
- 595 Durwood Dr
- 39 Beau Dr
- 618 Durwood Dr
- 102 Dandy Flush Ct
- 169 Mount Pleasant Rd
- 221 Old Hickory Dr
- 742 Adams Point Dr
- 73 Cinnecord Place
- 68 Cinnecord Place
- 63 Cinnecord Place
- 121 Leach Dr
- 53 Cinnecord Place
- 125 Leach Dr
- 109 Leach Dr
- 46 Cinnecord Place
- 113 Leach Dr
- 14980 Nc Highway 50 N
- 41 Cinnecord Place
- 129 Leach Dr
- 133 Leach Dr
- 105 Leach Dr
- 14882 Nc Highway 50 N
- 101 Leach Dr
- 31 Cinnecord Place
- 80 Buckeye Trail
- 14882 N Carolina 50
- 137 Leach Dr