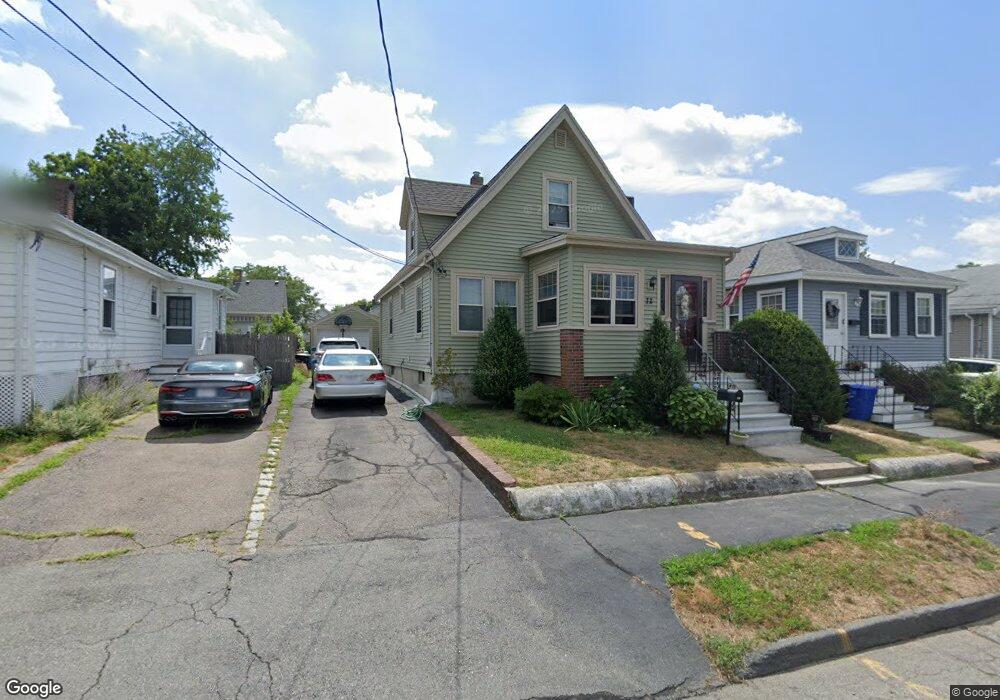
72 Cliff St Quincy, MA 02169
West Quincy NeighborhoodEstimated Value: $615,000 - $674,000
3
Beds
2
Baths
1,416
Sq Ft
$458/Sq Ft
Est. Value
About This Home
This home is located at 72 Cliff St, Quincy, MA 02169 and is currently estimated at $648,714, approximately $458 per square foot. 72 Cliff St is a home located in Norfolk County with nearby schools including Charles A. Bernazzani Elementary School, Central Middle School, and North Quincy High School.
Ownership History
Date
Name
Owned For
Owner Type
Purchase Details
Closed on
Dec 15, 2011
Sold by
Neighborhood Housing S
Bought by
Prifti Sokol and Tili Amanda
Current Estimated Value
Home Financials for this Owner
Home Financials are based on the most recent Mortgage that was taken out on this home.
Original Mortgage
$204,000
Outstanding Balance
$142,821
Interest Rate
4.01%
Mortgage Type
Purchase Money Mortgage
Estimated Equity
$505,893
Purchase Details
Closed on
Mar 8, 2011
Sold by
Us Bank Na
Bought by
Nbrhd Hsng Svcs
Purchase Details
Closed on
Jun 28, 2010
Sold by
Silva Isabel M
Bought by
Us Bk
Purchase Details
Closed on
Oct 22, 2004
Sold by
Torres Miguel E and Torres Olga L
Bought by
Silva Izabel M and Silva Onesimo S
Home Financials for this Owner
Home Financials are based on the most recent Mortgage that was taken out on this home.
Original Mortgage
$302,200
Interest Rate
5.85%
Mortgage Type
Purchase Money Mortgage
Create a Home Valuation Report for This Property
The Home Valuation Report is an in-depth analysis detailing your home's value as well as a comparison with similar homes in the area
Home Values in the Area
Average Home Value in this Area
Purchase History
| Date | Buyer | Sale Price | Title Company |
|---|---|---|---|
| Prifti Sokol | $265,000 | -- | |
| Nbrhd Hsng Svcs | $255,000 | -- | |
| Us Bk | $216,750 | -- | |
| Silva Izabel M | $379,000 | -- |
Source: Public Records
Mortgage History
| Date | Status | Borrower | Loan Amount |
|---|---|---|---|
| Open | Prifti Sokol | $204,000 | |
| Previous Owner | Silva Izabel M | $302,200 | |
| Previous Owner | Silva Izabel M | $75,000 |
Source: Public Records
Tax History
| Year | Tax Paid | Tax Assessment Tax Assessment Total Assessment is a certain percentage of the fair market value that is determined by local assessors to be the total taxable value of land and additions on the property. | Land | Improvement |
|---|---|---|---|---|
| 2025 | $5,854 | $507,700 | $250,600 | $257,100 |
| 2024 | $5,481 | $486,300 | $238,700 | $247,600 |
| 2023 | $5,144 | $462,200 | $227,300 | $234,900 |
| 2022 | $4,955 | $413,600 | $181,900 | $231,700 |
| 2021 | $4,710 | $388,000 | $181,900 | $206,100 |
| 2020 | $4,634 | $372,800 | $181,900 | $190,900 |
| 2019 | $4,593 | $366,000 | $176,600 | $189,400 |
| 2018 | $4,468 | $334,900 | $163,500 | $171,400 |
| 2017 | $4,464 | $315,000 | $155,700 | $159,300 |
| 2016 | $4,166 | $290,100 | $141,600 | $148,500 |
| 2015 | $3,943 | $270,100 | $133,600 | $136,500 |
| 2014 | $3,776 | $254,100 | $133,600 | $120,500 |
Source: Public Records
Map
Nearby Homes
- 114 Willard St Unit 4
- 41 Wallace Rd
- 230 Willard St Unit 102
- 440 Granite Ave Unit 201
- 84 Gardiner Rd
- 281 Elmwood Ave
- 40 Cross St Unit 1
- 0 Franklin St
- 1 Cityview Ln Unit 506
- 1 Cityview Ln Unit 709
- 1 Cityview Ln Unit 707
- 211 Copeland St
- 154 N Central Ave
- 459 Willard St Unit 303
- 1185 Brook Rd
- 46 Suomi Rd Unit 46
- 46 Suomi Rd
- 12 Nelson St
- 57 Buckley St
- 72 Oakland Ave
Your Personal Tour Guide
Ask me questions while you tour the home.