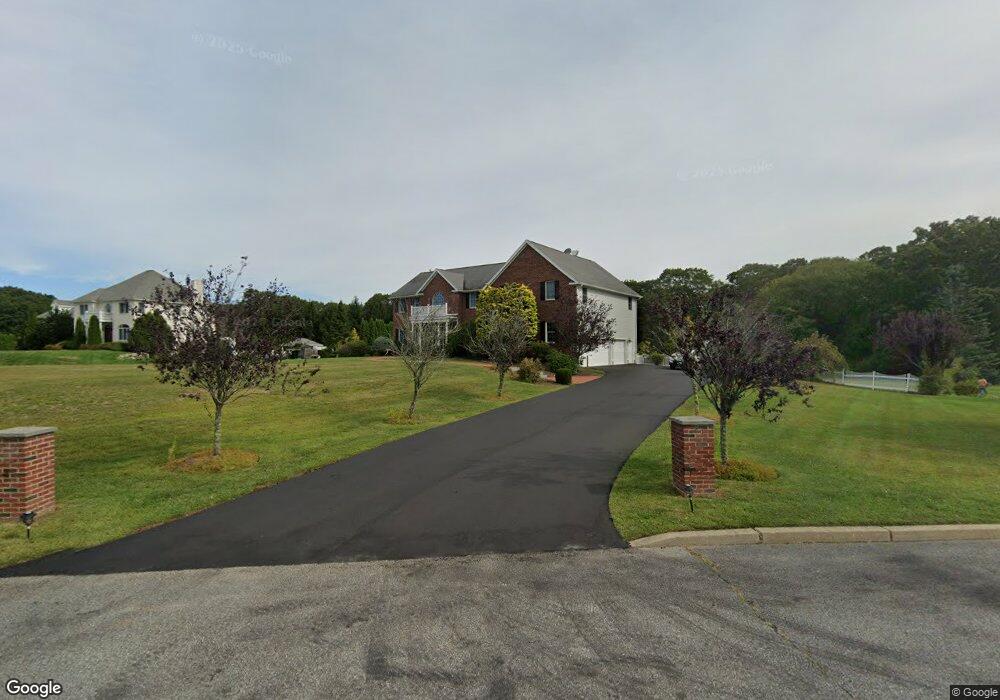
72 Crest Dr Cranston, RI 02921
Western Cranston NeighborhoodEstimated Value: $984,000 - $1,273,381
4
Beds
5
Baths
4,978
Sq Ft
$232/Sq Ft
Est. Value
About This Home
This home is located at 72 Crest Dr, Cranston, RI 02921 and is currently estimated at $1,157,345, approximately $232 per square foot. 72 Crest Dr is a home located in Providence County with nearby schools including Orchard Farms El. School, Hope Highlands Middle School, and Cranston High School West.
Ownership History
Date
Name
Owned For
Owner Type
Purchase Details
Closed on
Jul 11, 2011
Sold by
Uzzaman Khaliq
Bought by
Uzzaman Khaliq and Uzzaman Sadia
Current Estimated Value
Home Financials for this Owner
Home Financials are based on the most recent Mortgage that was taken out on this home.
Original Mortgage
$280,000
Outstanding Balance
$192,754
Interest Rate
4.6%
Estimated Equity
$964,591
Purchase Details
Closed on
Sep 19, 2008
Sold by
Kilduff Joseph L
Bought by
Uzzaman Khaliq
Purchase Details
Closed on
Sep 21, 2004
Sold by
Mccormick William and Mccormick Stephanie
Bought by
Kilduff Joseph
Purchase Details
Closed on
Aug 22, 2003
Sold by
Moretti Denise
Bought by
Mccormick William and Mccormick Stephanie
Purchase Details
Closed on
Nov 13, 2000
Sold by
R & M Properties Llc
Bought by
Moretti Denise M
Create a Home Valuation Report for This Property
The Home Valuation Report is an in-depth analysis detailing your home's value as well as a comparison with similar homes in the area
Home Values in the Area
Average Home Value in this Area
Purchase History
| Date | Buyer | Sale Price | Title Company |
|---|---|---|---|
| Uzzaman Khaliq | -- | -- | |
| Uzzaman Khaliq | $550,000 | -- | |
| Kilduff Joseph | $685,000 | -- | |
| Mccormick William | $612,000 | -- | |
| Moretti Denise M | $465,000 | -- |
Source: Public Records
Mortgage History
| Date | Status | Borrower | Loan Amount |
|---|---|---|---|
| Open | Moretti Denise M | $175,000 | |
| Open | Moretti Denise M | $280,000 |
Source: Public Records
Tax History
| Year | Tax Paid | Tax Assessment Tax Assessment Total Assessment is a certain percentage of the fair market value that is determined by local assessors to be the total taxable value of land and additions on the property. | Land | Improvement |
|---|---|---|---|---|
| 2025 | $13,772 | $992,200 | $217,300 | $774,900 |
| 2024 | $13,504 | $992,200 | $217,300 | $774,900 |
| 2023 | $11,221 | $593,700 | $112,600 | $481,100 |
| 2022 | $10,989 | $593,700 | $112,600 | $481,100 |
| 2021 | $10,687 | $593,700 | $112,600 | $481,100 |
| 2020 | $11,077 | $533,300 | $144,700 | $388,600 |
| 2019 | $11,077 | $533,300 | $144,700 | $388,600 |
| 2018 | $10,821 | $533,300 | $144,700 | $388,600 |
| 2017 | $12,672 | $552,400 | $193,000 | $359,400 |
| 2016 | $12,401 | $552,400 | $193,000 | $359,400 |
| 2015 | $12,401 | $552,400 | $193,000 | $359,400 |
| 2014 | $12,585 | $551,000 | $214,400 | $336,600 |
Source: Public Records
Map
Nearby Homes
- 154 Beechwood Dr
- 244 Beechwood Dr
- 5 Elizabeth Ln
- 12 Beechwood Dr
- 2202 Scituate Ave
- 01 Paula Ln
- 02 Paula Ln
- 1495 Pippin Orchard Rd
- 73 Lantern Hill Dr
- 77 Lantern Hill Dr
- 560 Seven Mile Rd
- 82 Mohawk Trail
- 22 Derby Ln
- 311 Hope Rd
- 73 Nottingham Dr
- 0 Anthony Dr Unit 1394338
- 1340 Hope Rd
- 117 Moccasin Trail
- 7 Gray Coach W Unit 711
- 74 Cardinal Rd
Your Personal Tour Guide
Ask me questions while you tour the home.