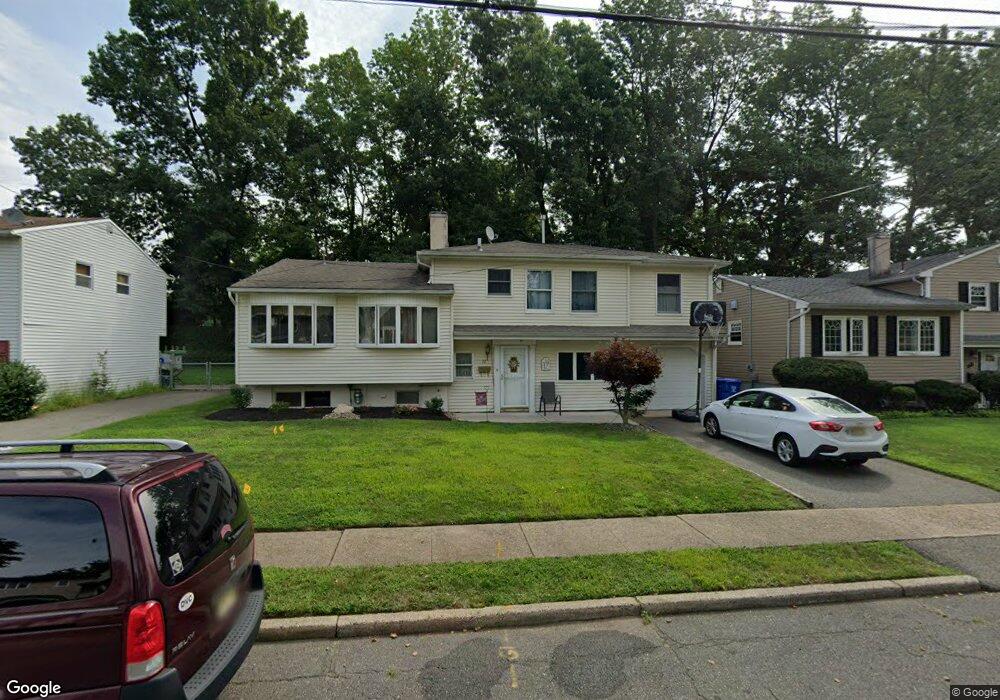
72 Cypress Dr Colonia, NJ 07067
Estimated Value: $436,693 - $746,000
Studio
--
Bath
1,872
Sq Ft
$346/Sq Ft
Est. Value
About This Home
This home is located at 72 Cypress Dr, Colonia, NJ 07067 and is currently estimated at $648,423, approximately $346 per square foot. 72 Cypress Dr is a home located in Middlesex County with nearby schools including Oak Ridge Heights Elementary School, Colonia Middle School, and Colonia High School.
Ownership History
Date
Name
Owned For
Owner Type
Purchase Details
Closed on
Aug 17, 1998
Sold by
Dumansky H Mark
Bought by
Franczak David and Franczak Sandra
Current Estimated Value
Home Financials for this Owner
Home Financials are based on the most recent Mortgage that was taken out on this home.
Original Mortgage
$172,400
Outstanding Balance
$35,872
Interest Rate
6.89%
Estimated Equity
$612,551
Create a Home Valuation Report for This Property
The Home Valuation Report is an in-depth analysis detailing your home's value as well as a comparison with similar homes in the area
Home Values in the Area
Average Home Value in this Area
Purchase History
| Date | Buyer | Sale Price | Title Company |
|---|---|---|---|
| Franczak David | $181,500 | -- |
Source: Public Records
Mortgage History
| Date | Status | Borrower | Loan Amount |
|---|---|---|---|
| Open | Franczak David | $172,400 |
Source: Public Records
Tax History
| Year | Tax Paid | Tax Assessment Tax Assessment Total Assessment is a certain percentage of the fair market value that is determined by local assessors to be the total taxable value of land and additions on the property. | Land | Improvement |
|---|---|---|---|---|
| 2025 | $12,015 | $99,300 | $22,000 | $77,300 |
| 2024 | $11,755 | $99,300 | $22,000 | $77,300 |
| 2023 | $11,755 | $99,300 | $22,000 | $77,300 |
| 2022 | $11,463 | $99,300 | $22,000 | $77,300 |
| 2021 | $11,323 | $98,900 | $22,000 | $76,900 |
| 2020 | $10,982 | $98,900 | $22,000 | $76,900 |
| 2019 | $10,722 | $98,900 | $22,000 | $76,900 |
| 2018 | $10,518 | $98,900 | $22,000 | $76,900 |
| 2017 | $10,333 | $98,900 | $22,000 | $76,900 |
| 2016 | $10,253 | $98,900 | $22,000 | $76,900 |
| 2015 | $10,073 | $98,900 | $22,000 | $76,900 |
| 2014 | $9,857 | $98,900 | $22,000 | $76,900 |
Source: Public Records
Map
Nearby Homes
- 125 Kimberly Rd
- 53 Jordan Rd
- 17 Thelma Ct
- 8 Normandy Rd
- 131 Morningside Rd
- 34 E Prescott Ave
- 64 William St
- 172 Briarheath Ln
- 372 Willow Way
- 11 Lyric Dr
- 973 Ellis Pkwy
- 112 W Willow St
- 244 W Prescott Ave
- 868 Inman Ave
- 24 Woodland Rd
- 20 Alastair Place
- 2 Cherbar Ct
- 786 Wood Ave
- 18 Cherbar Ct
- 46 Taylor Terrace
Your Personal Tour Guide
Ask me questions while you tour the home.